Answered step by step
Verified Expert Solution
Link Copied!

Question

1 Approved Answer

Hi, I need help with explanation and answer to this question. Q) The graph below shows a proportional relationship between the amount saved (in dollars)

Hi,

I need help with explanation and answer to this question.
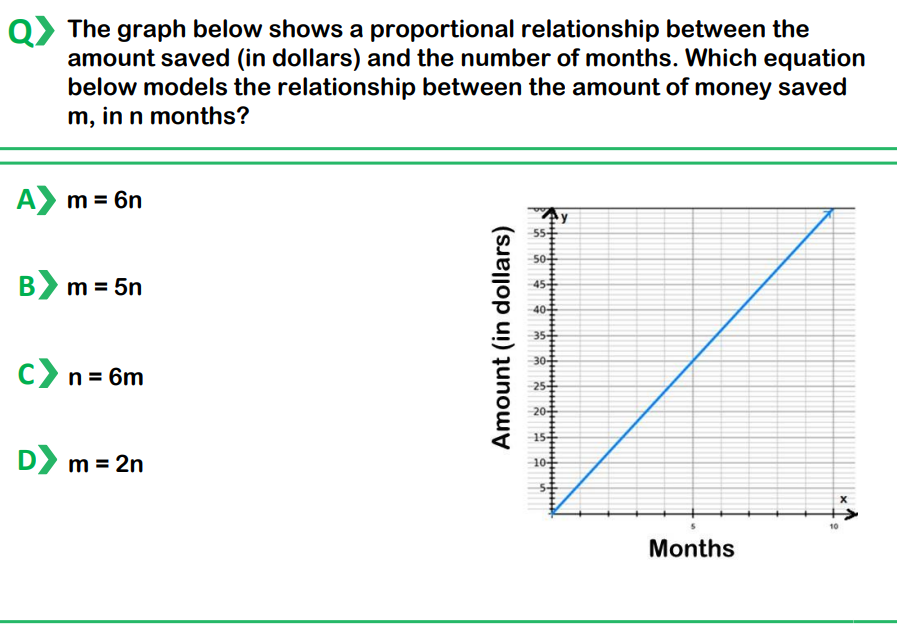
image text in transcribed
Q) The graph below shows a proportional relationship between the amount saved (in dollars) and the number of months. Which equation below models the relationship between the amount of money saved m, in n months? A> m = 6n 50 - m = 5n Amount (in dollars) C> n= 6m 25 15 D) m = 2n 10 Months

Step by Step Solution

There are 3 Steps involved in it

Step: 1

blur-text-image

Get Instant Access to Expert-Tailored Solutions

See step-by-step solutions with expert insights and AI powered tools for academic success

Step: 2

blur-text-image

Step: 3

blur-text-image

Ace Your Homework with AI

Get the answers you need in no time with our AI-driven, step-by-step assistance

Get Started

Recommended Textbook for

Elementary Algebra

Authors: Charles P McKeague

2nd Edition

ISBN: 1483263819, 9781483263816

More Books

Students also viewed these Mathematics questions

Question

What are the objectives of Human resource planning ?

Answered: 1 week ago

Question

Explain the process of Human Resource Planning.

Answered: 1 week ago

Question

7-16 Compare Web 2.0 and Web 3.0.

Answered: 1 week ago