Answered step by step
Verified Expert Solution
Question
1 Approved Answer
Hi, I need help with figuring out what numbers is supposed to be in the excel files rows (from prepaid expenses and down). This is
Hi,
I need help with figuring out what numbers is supposed to be in the excel files rows (from prepaid expenses and down).
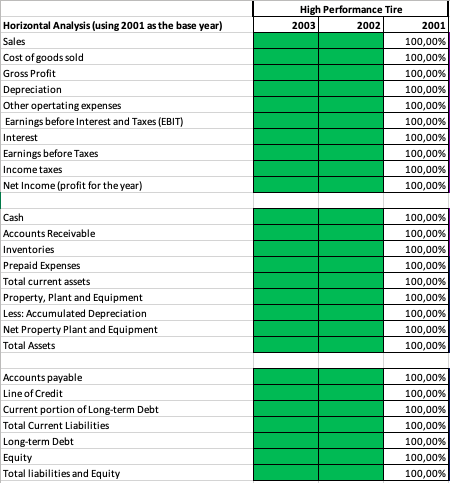
This is the numbers I have to figure out the numbers.
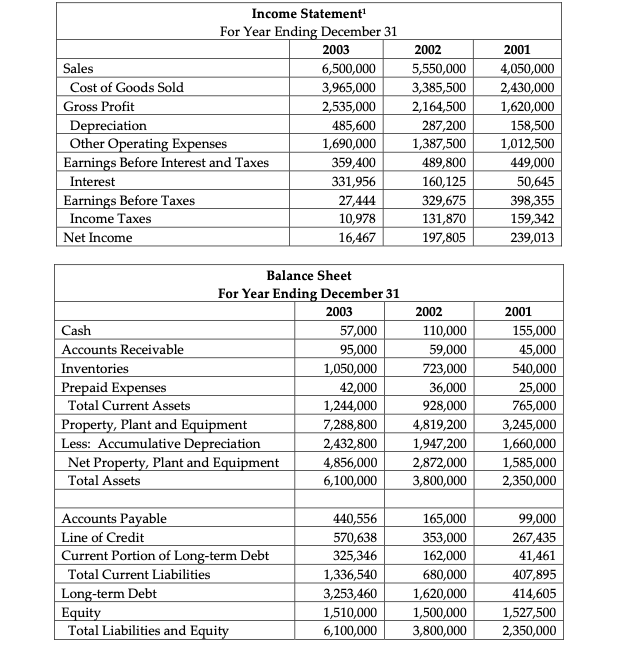
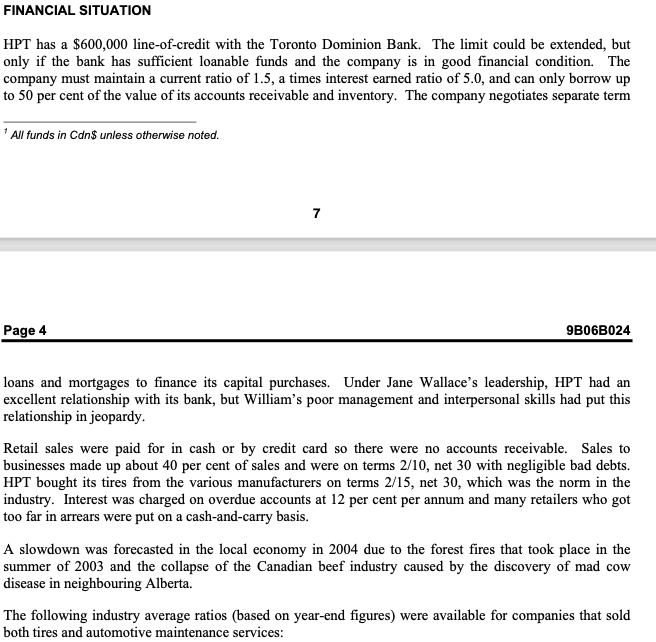
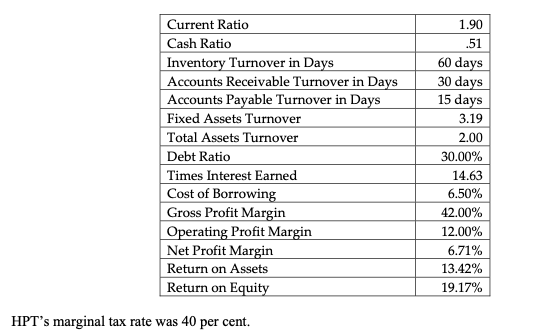
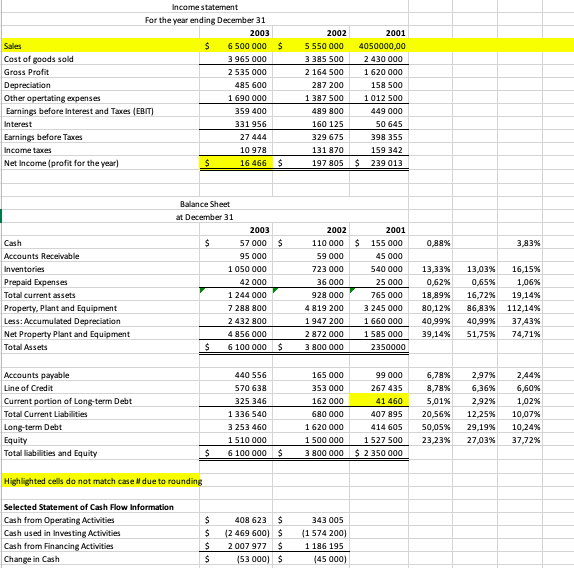 Is this the information needed to be answered?
Thank you.
Horizontal Analysis (using 2001 as the base year) Sales Cost of goods sold Gross Profit Depreciation Other opertating expenses Earnings before Interest and Taxes (EBIT) Interest Earnings before Taxes Income taxes Net Income (profit for the year) High Performance Tire 2003 2002 2001 100,00% 100,00% 100,00% 100,00% 100,00% 100,00% 100,00% 100,00% 100,00% 100,00% Cash Accounts Receivable Inventories Prepaid Expenses Total current assets Property, plant and Equipment Less: Accumulated Depreciation Net Property Plant and Equipment Total Assets 100,00% 100,00% 100,00% 100,00% 100,00% 100,00% 100,00% 100,00% 100,00% Accounts payable Line of Credit Current portion of Long-term Debt Total Current Liabilities Long-term Debt Equity Total liabilities and Equity 100,00% 100,00% 100,00% 100,00% 100,00% 100,00% 100,00% Income Statement For Year Ending December 31 2003 2002 Sales 6,500,000 5,550,000 Cost of Goods Sold 3,965,000 3,385,500 Gross Profit 2,535,000 2,164,500 Depreciation 485,600 287,200 Other Operating Expenses 1,690,000 1,387,500 Earnings Before Interest and Taxes 359,400 489,800 Interest 331,956 160,125 Earnings Before Taxes 27,444 329,675 Income Taxes 10,978 131,870 Net Income 16,467 197,805 2001 4,050,000 2,430,000 1,620,000 158,500 1,012,500 449,000 50,645 398,355 159,342 239,013 Balance Sheet For Year Ending December 31 2003 2002 Cash 57,000 110,000 Accounts Receivable 95,000 59,000 Inventories 1,050,000 723,000 Prepaid Expenses 42,000 36,000 Total Current Assets 1,244,000 928,000 Property, Plant and Equipment 7,288,800 4,819,200 Less: Accumulative Depreciation 2,432,800 1,947,200 Net Property, Plant and Equipment 4,856,000 2,872,000 Total Assets 6,100,000 3,800,000 2001 155,000 45,000 540,000 25,000 765,000 3,245,000 1,660,000 1,585,000 2,350,000 Accounts Payable Line of Credit Current Portion of Long-term Debt Total Current Liabilities Long-term Debt Equity Total Liabilities and Equity 440,556 570,638 325,346 1,336,540 3,253,460 1,510,000 6,100,000 165,000 353,000 162,000 680,000 1,620,000 1,500,000 3,800,000 99,000 267,435 41,461 407,895 414,605 1,527,500 2,350,000 FINANCIAL SITUATION HPT has a $600,000 line-of-credit with the Toronto Dominion Bank. The limit could be extended, but only if the bank has sufficient loanable funds and the company is in good financial condition. The company must maintain a current ratio of 1.5, a times interest earned ratio of 5.0, and can only borrow up to 50 per cent of the value of its accounts receivable and inventory. The company negotiates separate term All funds in Cans unless otherwise noted. 7 Page 4 9B06B024 loans and mortgages to finance its capital purchases. Under Jane Wallace's leadership, HPT had an excellent relationship with its bank, but William's poor management and interpersonal skills had put this relationship in jeopardy Retail sales were paid for in cash or by credit card so there were no accounts receivable. Sales to businesses made up about 40 per cent of sales and were on terms 2/10, net 30 with negligible bad debts. HPT bought its tires from the various manufacturers on terms 2/15, net 30, which was the norm in the industry. Interest was charged on overdue accounts at 12 per cent per annum and many retailers who got too far in arrears were put on a cash-and-carry basis. A slowdown was forecasted in the local economy in 2004 due to the forest fires that took place in the summer of 2003 and the collapse of the Canadian beef industry caused by the discovery of mad cow disease in neighbouring Alberta. The following industry average ratios (based on year-end figures) were available for companies that sold both tires and automotive maintenance services: Current Ratio Cash Ratio Inventory Turnover in Days Accounts Receivable Turnover in Days Accounts Payable Turnover in Days Fixed Assets Turnover Total Assets Turnover Debt Ratio Times Interest Earned Cost of Borrowing Gross Profit Margin Operating Profit Margin Net Profit Margin Return on Assets Return on Equity 1.90 .51 60 days 30 days 15 days 3.19 2.00 30.00% 14.63 6.50% 42.00% 12.00% 6.71% 13.42% 19.17% HPT's marginal tax rate was 40 per cent. Income statement For the year ending December 31 2003 Sales $ 6 500 000 $ Cost of goods sold 3 965 000 Gross Profit 2 535 000 Depreciation 485 600 Other operating expenses 1 690 000 Earnings before interest and Taxes (EBIT) 359 400 Interest 331 956 Earnings before Taxes 27 444 Income taxes 10 978 Net Income (profit for the year) $ 16 466 $ 2002 5 550 000 3 385 500 2 164 500 287 200 1 387 500 489 800 160 125 329 675 131 870 197 805 2001 4050000,00 2430 000 1620 000 158 500 1012 500 449 000 50 645 398 355 159 342 $ 239 013 Balance Sheet at December 31 2003 $ $ 0.88% 3,83% Cash Accounts Receivable Inventories Prepaid Expenses Total current assets Property, Plant and Equipment Less: Accumulated Depreciation Net Property Plant and Equipment Total Assets 57 000 95 000 1 050 000 42 000 1 244000 7 288 800 2432 800 4856 000 6 100 000 2002 110 000 59 000 723 000 36 000 928 000 4 819 200 1947 200 2 872 000 3 800 000 2001 $ 155 000 45 000 540 000 25 000 765 000 3 245 000 1 660 000 1585 000 2350000 13,33% 0,62% 18,89% 80,12% 40,99% 39,14% 13,03% 0,65% 16,72% 86,83% 40,99% 51,75% 16,15% 1,06% 19,14% 112,14% 37,43% 74,71% $ $ Accounts payable Line of Credit Current portion of Long-term Debt Total Current Liabilities Long-term Debt Equity Total liabilities and Equity 440 556 570 638 325 346 1 336 540 3 253 460 1 510 000 6 100 000 165 000 353 000 162 000 680 000 1620 000 1 500 000 3 800 000 99 000 267 435 41 460 407 895 414 605 1527 500 $ 2 350 000 6,78% 8,78% 5,01% 20,56% 50,05% 23,23% 2.97% 6,36% 2,92% 12,25% 29,19% 27,03% 2.44% 6,60% 1,02% 10,07% 10,24% 37,72% $ $ Highlighted cells do not match case #due to rounding Selected Statement of Cash Flow Information Cash from Operating Activities Cash used in Investing Activities Cash from Financing Activities Change in Cash $ $ $ $ 408 623 $ (2 469 600) $ 2007 977 $ (53 000) $ 343 005 (1 574 200) 1 186 195 (45000) Horizontal Analysis (using 2001 as the base year) Sales Cost of goods sold Gross Profit Depreciation Other opertating expenses Earnings before Interest and Taxes (EBIT) Interest Earnings before Taxes Income taxes Net Income (profit for the year) High Performance Tire 2003 2002 2001 100,00% 100,00% 100,00% 100,00% 100,00% 100,00% 100,00% 100,00% 100,00% 100,00% Cash Accounts Receivable Inventories Prepaid Expenses Total current assets Property, plant and Equipment Less: Accumulated Depreciation Net Property Plant and Equipment Total Assets 100,00% 100,00% 100,00% 100,00% 100,00% 100,00% 100,00% 100,00% 100,00% Accounts payable Line of Credit Current portion of Long-term Debt Total Current Liabilities Long-term Debt Equity Total liabilities and Equity 100,00% 100,00% 100,00% 100,00% 100,00% 100,00% 100,00% Income Statement For Year Ending December 31 2003 2002 Sales 6,500,000 5,550,000 Cost of Goods Sold 3,965,000 3,385,500 Gross Profit 2,535,000 2,164,500 Depreciation 485,600 287,200 Other Operating Expenses 1,690,000 1,387,500 Earnings Before Interest and Taxes 359,400 489,800 Interest 331,956 160,125 Earnings Before Taxes 27,444 329,675 Income Taxes 10,978 131,870 Net Income 16,467 197,805 2001 4,050,000 2,430,000 1,620,000 158,500 1,012,500 449,000 50,645 398,355 159,342 239,013 Balance Sheet For Year Ending December 31 2003 2002 Cash 57,000 110,000 Accounts Receivable 95,000 59,000 Inventories 1,050,000 723,000 Prepaid Expenses 42,000 36,000 Total Current Assets 1,244,000 928,000 Property, Plant and Equipment 7,288,800 4,819,200 Less: Accumulative Depreciation 2,432,800 1,947,200 Net Property, Plant and Equipment 4,856,000 2,872,000 Total Assets 6,100,000 3,800,000 2001 155,000 45,000 540,000 25,000 765,000 3,245,000 1,660,000 1,585,000 2,350,000 Accounts Payable Line of Credit Current Portion of Long-term Debt Total Current Liabilities Long-term Debt Equity Total Liabilities and Equity 440,556 570,638 325,346 1,336,540 3,253,460 1,510,000 6,100,000 165,000 353,000 162,000 680,000 1,620,000 1,500,000 3,800,000 99,000 267,435 41,461 407,895 414,605 1,527,500 2,350,000 FINANCIAL SITUATION HPT has a $600,000 line-of-credit with the Toronto Dominion Bank. The limit could be extended, but only if the bank has sufficient loanable funds and the company is in good financial condition. The company must maintain a current ratio of 1.5, a times interest earned ratio of 5.0, and can only borrow up to 50 per cent of the value of its accounts receivable and inventory. The company negotiates separate term All funds in Cans unless otherwise noted. 7 Page 4 9B06B024 loans and mortgages to finance its capital purchases. Under Jane Wallace's leadership, HPT had an excellent relationship with its bank, but William's poor management and interpersonal skills had put this relationship in jeopardy Retail sales were paid for in cash or by credit card so there were no accounts receivable. Sales to businesses made up about 40 per cent of sales and were on terms 2/10, net 30 with negligible bad debts. HPT bought its tires from the various manufacturers on terms 2/15, net 30, which was the norm in the industry. Interest was charged on overdue accounts at 12 per cent per annum and many retailers who got too far in arrears were put on a cash-and-carry basis. A slowdown was forecasted in the local economy in 2004 due to the forest fires that took place in the summer of 2003 and the collapse of the Canadian beef industry caused by the discovery of mad cow disease in neighbouring Alberta. The following industry average ratios (based on year-end figures) were available for companies that sold both tires and automotive maintenance services: Current Ratio Cash Ratio Inventory Turnover in Days Accounts Receivable Turnover in Days Accounts Payable Turnover in Days Fixed Assets Turnover Total Assets Turnover Debt Ratio Times Interest Earned Cost of Borrowing Gross Profit Margin Operating Profit Margin Net Profit Margin Return on Assets Return on Equity 1.90 .51 60 days 30 days 15 days 3.19 2.00 30.00% 14.63 6.50% 42.00% 12.00% 6.71% 13.42% 19.17% HPT's marginal tax rate was 40 per cent. Income statement For the year ending December 31 2003 Sales $ 6 500 000 $ Cost of goods sold 3 965 000 Gross Profit 2 535 000 Depreciation 485 600 Other operating expenses 1 690 000 Earnings before interest and Taxes (EBIT) 359 400 Interest 331 956 Earnings before Taxes 27 444 Income taxes 10 978 Net Income (profit for the year) $ 16 466 $ 2002 5 550 000 3 385 500 2 164 500 287 200 1 387 500 489 800 160 125 329 675 131 870 197 805 2001 4050000,00 2430 000 1620 000 158 500 1012 500 449 000 50 645 398 355 159 342 $ 239 013 Balance Sheet at December 31 2003 $ $ 0.88% 3,83% Cash Accounts Receivable Inventories Prepaid Expenses Total current assets Property, Plant and Equipment Less: Accumulated Depreciation Net Property Plant and Equipment Total Assets 57 000 95 000 1 050 000 42 000 1 244000 7 288 800 2432 800 4856 000 6 100 000 2002 110 000 59 000 723 000 36 000 928 000 4 819 200 1947 200 2 872 000 3 800 000 2001 $ 155 000 45 000 540 000 25 000 765 000 3 245 000 1 660 000 1585 000 2350000 13,33% 0,62% 18,89% 80,12% 40,99% 39,14% 13,03% 0,65% 16,72% 86,83% 40,99% 51,75% 16,15% 1,06% 19,14% 112,14% 37,43% 74,71% $ $ Accounts payable Line of Credit Current portion of Long-term Debt Total Current Liabilities Long-term Debt Equity Total liabilities and Equity 440 556 570 638 325 346 1 336 540 3 253 460 1 510 000 6 100 000 165 000 353 000 162 000 680 000 1620 000 1 500 000 3 800 000 99 000 267 435 41 460 407 895 414 605 1527 500 $ 2 350 000 6,78% 8,78% 5,01% 20,56% 50,05% 23,23% 2.97% 6,36% 2,92% 12,25% 29,19% 27,03% 2.44% 6,60% 1,02% 10,07% 10,24% 37,72% $ $ Highlighted cells do not match case #due to rounding Selected Statement of Cash Flow Information Cash from Operating Activities Cash used in Investing Activities Cash from Financing Activities Change in Cash $ $ $ $ 408 623 $ (2 469 600) $ 2007 977 $ (53 000) $ 343 005 (1 574 200) 1 186 195 (45000)Step by Step Solution
There are 3 Steps involved in it
Step: 1

Get Instant Access to Expert-Tailored Solutions
See step-by-step solutions with expert insights and AI powered tools for academic success
Step: 2

Step: 3

Ace Your Homework with AI
Get the answers you need in no time with our AI-driven, step-by-step assistance
Get Started


