Answered step by step
Verified Expert Solution
Link Copied!

Question

1 Approved Answer

Hi I need help with the correct answer please... Page Graphs are a way of organizing and explaining data. Sometimes data is qualitative (non-numeric data

Hi I need help with the correct answer please...
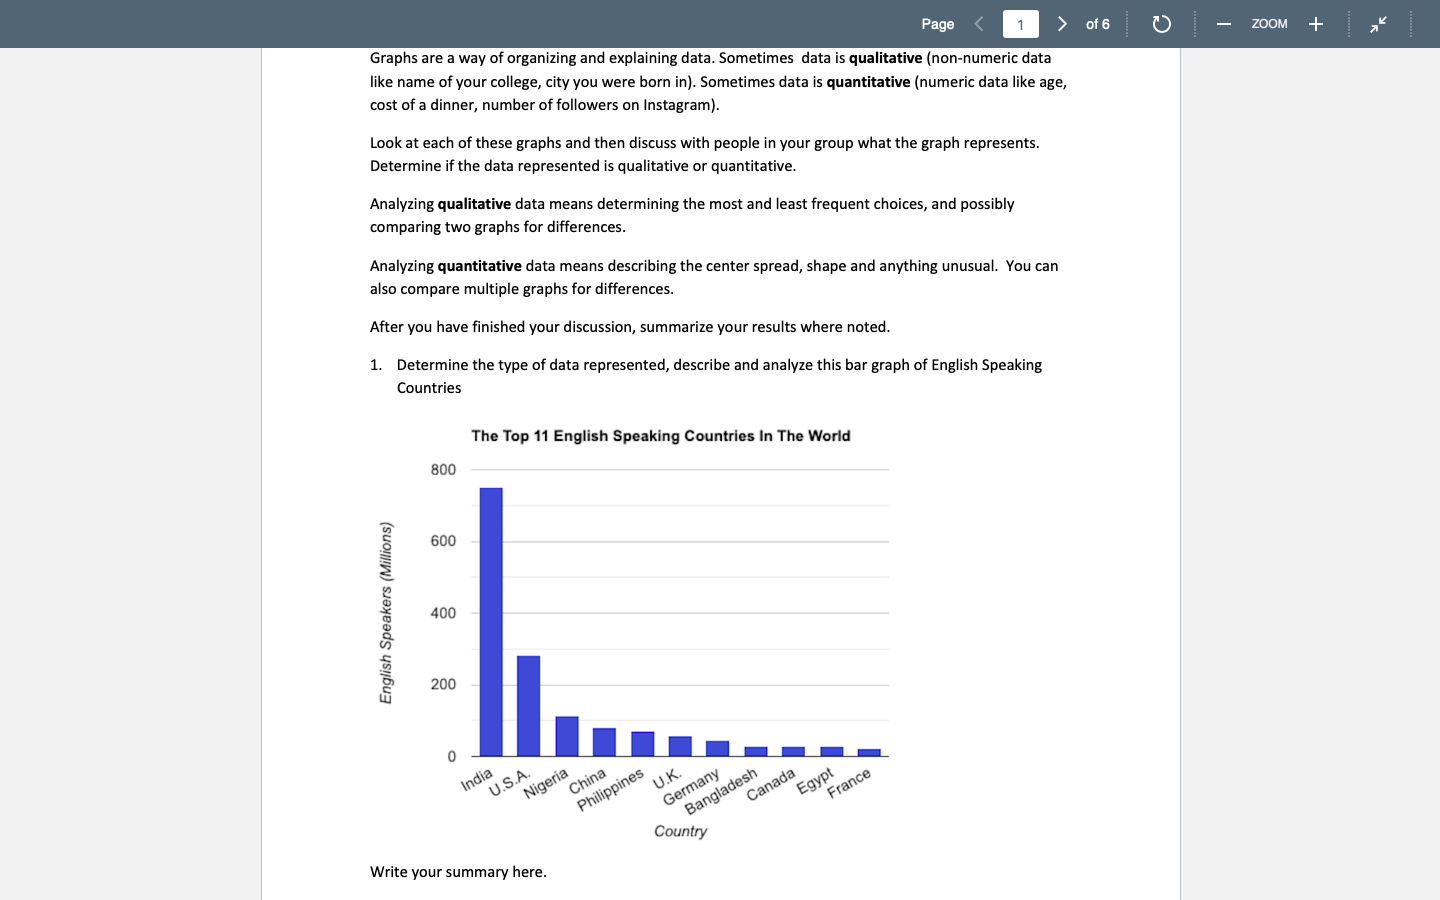
image text in transcribedimage text in transcribedimage text in transcribedimage text in transcribedimage text in transcribed
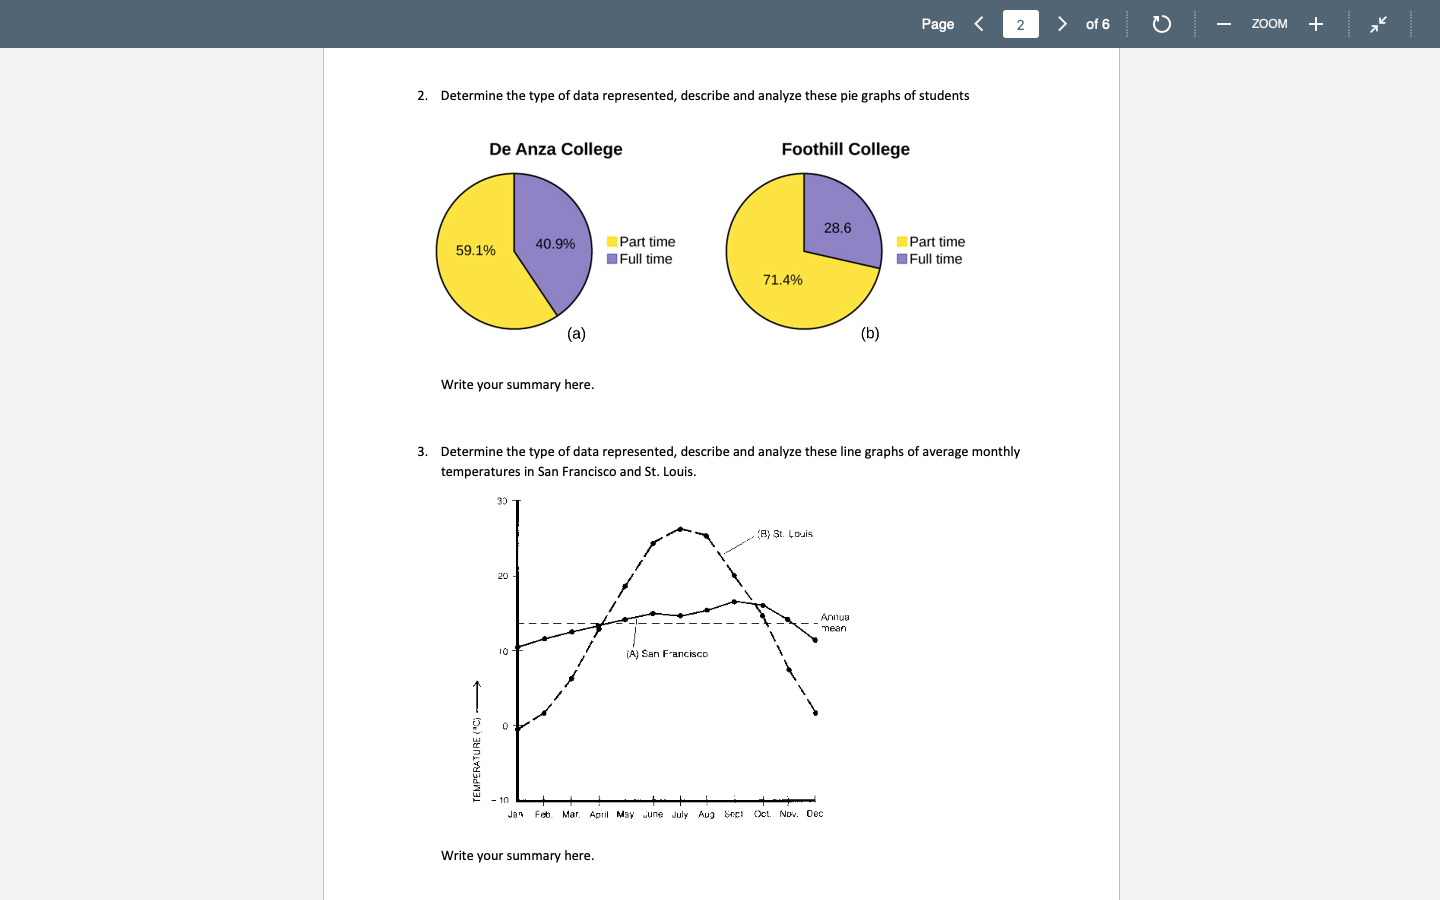
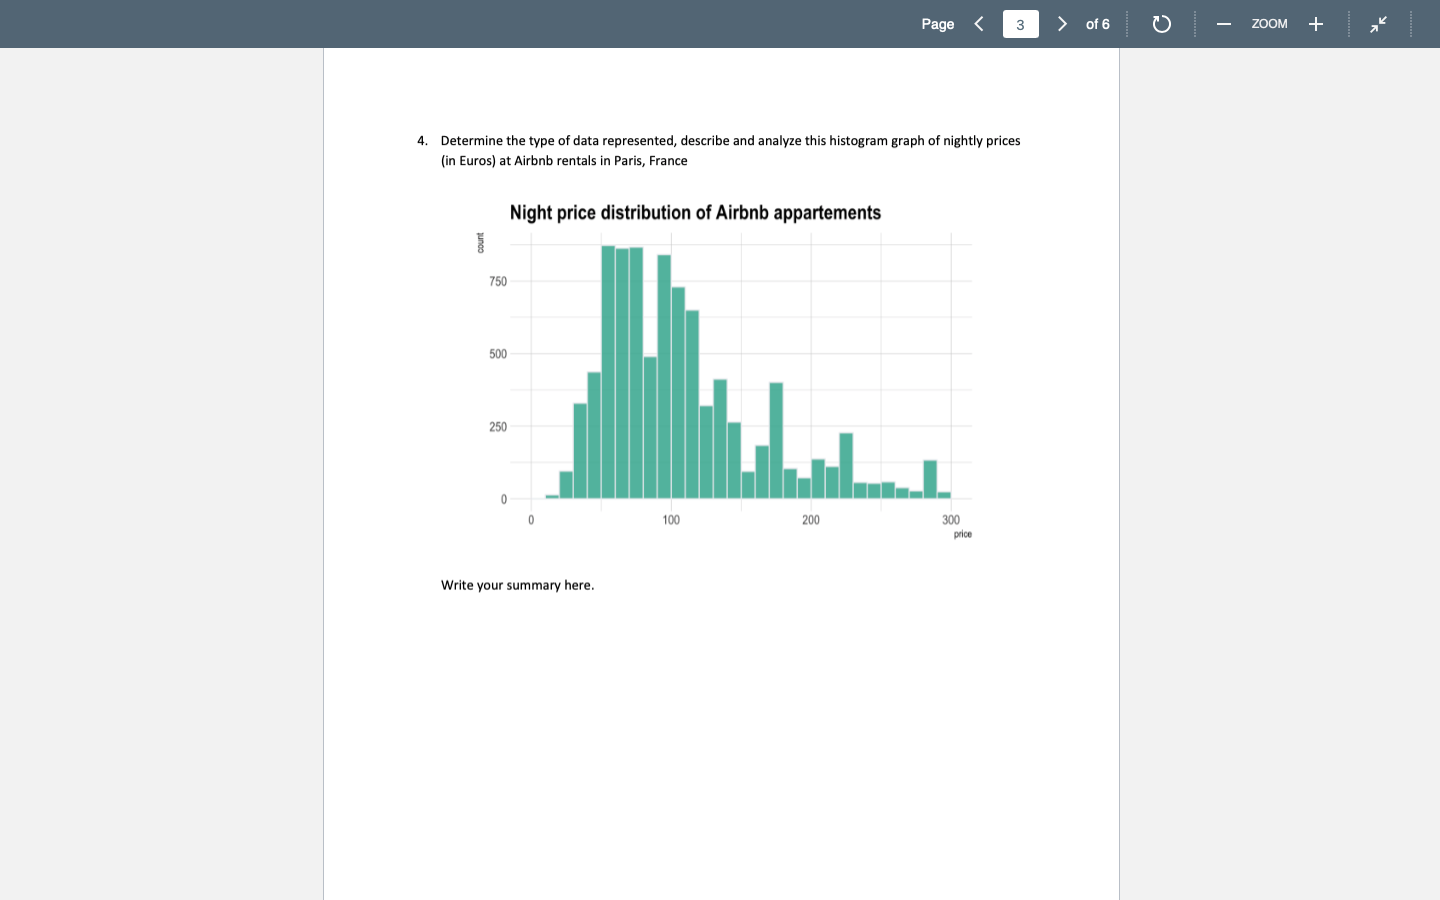
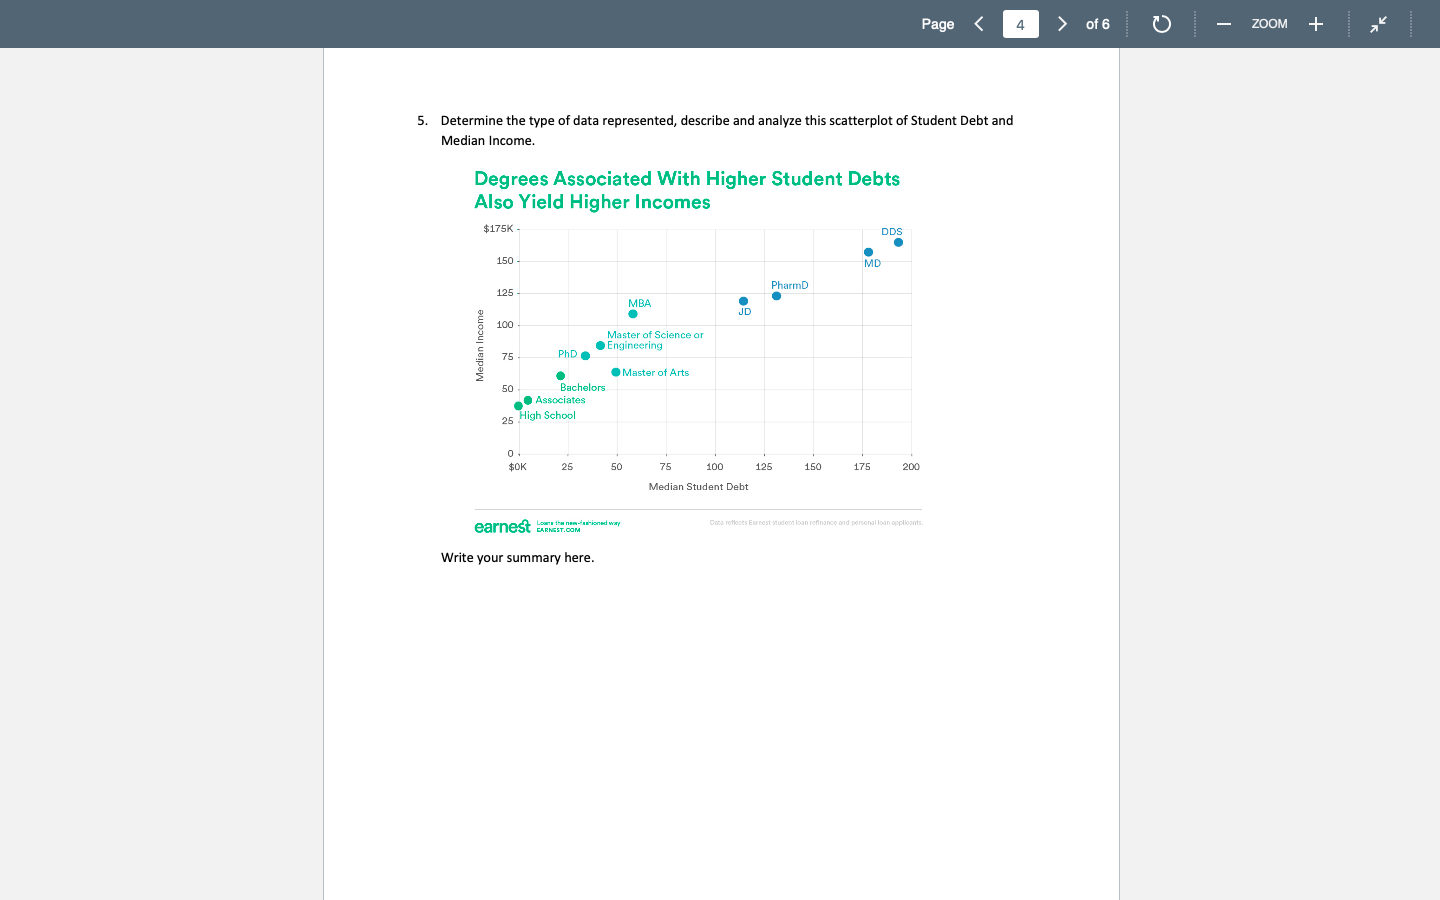
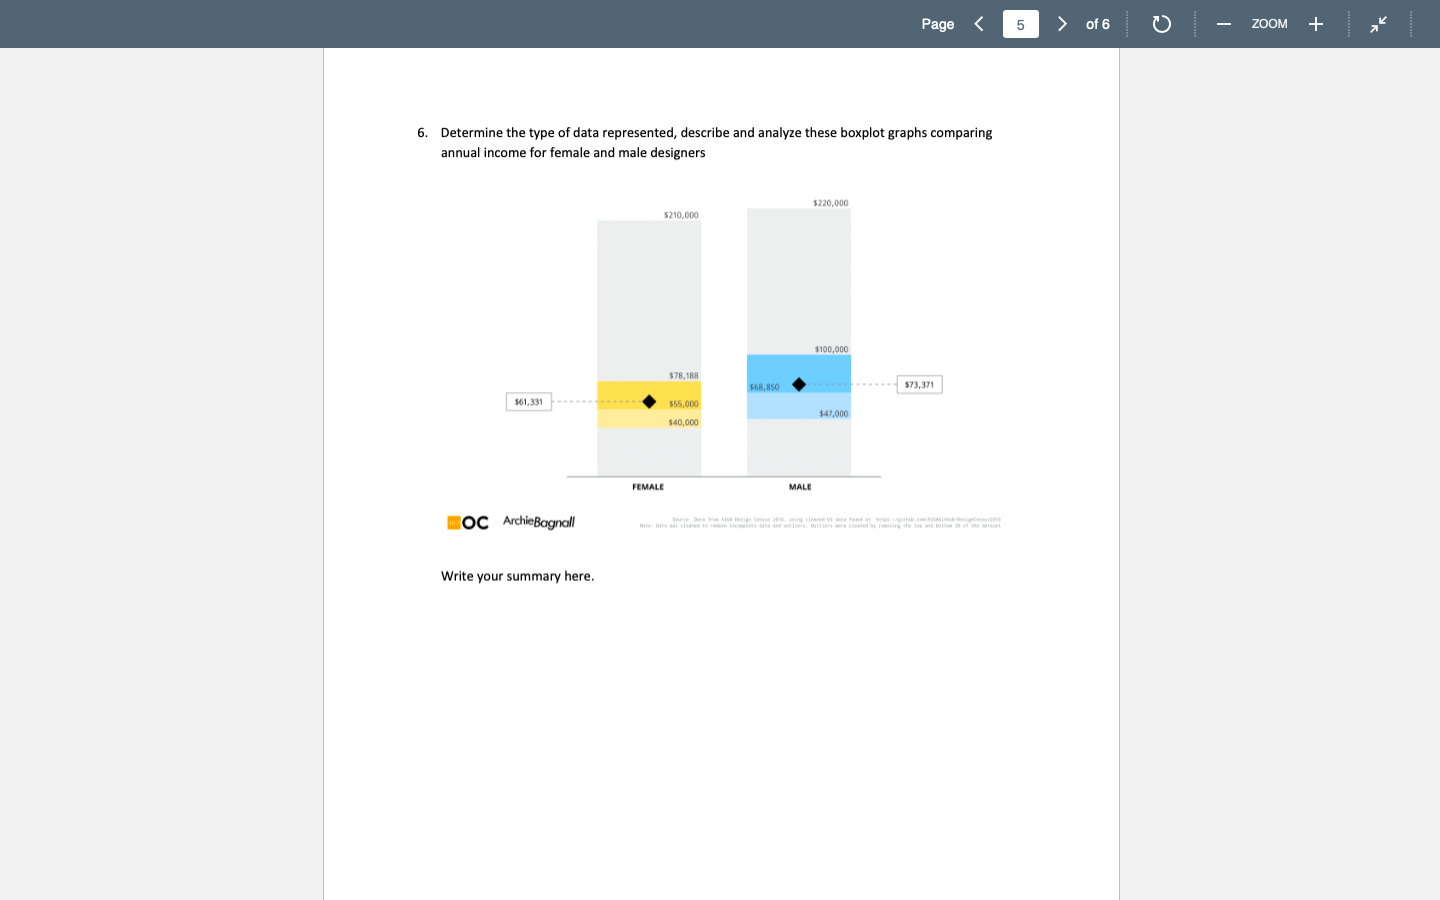
Page Graphs are a way of organizing and explaining data. Sometimes data is qualitative (non-numeric data like name of your college, city you were born in]. Sometimes data is quantitative (numeric data like age, oost ofa dinner, number of'lollowers on Instagram). Look at each of these graphs and then discuss with people in your group what the graph represents. Determine if the data re presented is qualitative or quantitative. Analyzing qualitative data means determining the most and least frequent choices, and possibly comparing two graphs for differences. Analyzing quantitative data means describing the center spread, shape and anything unusual. You can also compare multiple graphs for differences. After you have nished your discussion, summarize your results where noted. 1. Determine the type of data represented, describe and analyze this bar graph of English Speaking Countries The Top 11 Engllsh Speaking Countries In The Wnrid BIJO 600 400 200 I o I..------_ we\") I m\" \"65?\" @9le v9\" ' gi'd' v, \"a\"? Country English Speakers (Millions) Write your summary here. ZDD M + Page of 6 ZOOM + 6. Determine the type of data represented, describe and analyze these boxplot graphs comparing annual income for female and male designers $220,000 $210,000 $100,000 $78, 18 $68, 850 - . ." $73,371 $61,331 $55,000 $47,000 $40,000 FEMALE MALE HOC ArchieBagnall Write your summary here

Step by Step Solution

There are 3 Steps involved in it

Step: 1

blur-text-image

Get Instant Access to Expert-Tailored Solutions

See step-by-step solutions with expert insights and AI powered tools for academic success

Step: 2

blur-text-image

Step: 3

blur-text-image

Ace Your Homework with AI

Get the answers you need in no time with our AI-driven, step-by-step assistance

Get Started

Recommended Textbook for

Intermediate Algebra With Trigonometry

Authors: Charles P McKeague

1st Edition

1483218759, 9781483218755

More Books

Students also viewed these Mathematics questions