

Question
Hi I need help with these math practice homework questions. (Grade 11 Functions - Exponential Functions (Unit). I have attempted some of these, but I'm
Hi I need help with these math practice homework questions. (Grade 11 Functions -Exponential Functions(Unit).
I have attempted some of these, but I'm not sure it is correct and I'm still confused about creating the estimated exponential function equation (by using the data values- and the ratios)
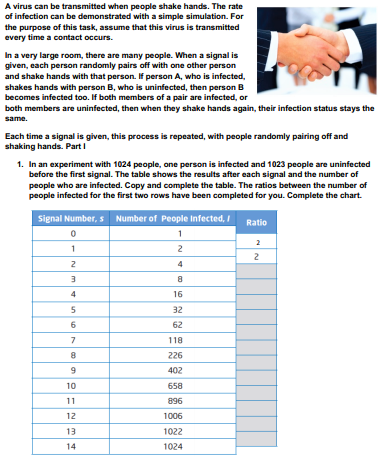
- the questions are based off of the chart/table of values in the image I inserted
Questions
1. Graph the data from the table of values (not the ratio) ~ hand drawn
2.Is the table of values is best described by a linear, quadratic or exponential function? Explain.
3. Make an equation for this function (based off of the table of values/graph) & show your work. Identify the following features of your function:
- a) The growth rate
- b) The initial value
- c) The exponent
- d) Vertical asymptote (if any)
- e) Horizontal asymptote (if any)
- f) x and y intercepts (if any)
- g) The domain and range
- h) Can you think of any factors that might lead to restrictions on the domain and range of this model?
- i) Over what domain and range does the model representing the spread of infection approximately fit an exponential function?
Step by Step Solution
There are 3 Steps involved in it
Step: 1

Get Instant Access to Expert-Tailored Solutions
See step-by-step solutions with expert insights and AI powered tools for academic success
Step: 2

Step: 3
Ace Your Homework with AI
Get the answers you need in no time with our AI-driven, step-by-step assistance
Get Started
Introduction to Real Analysis
Authors: Robert G. Bartle, Donald R. Sherbert
4th edition
471433314, 978-1118135853, 1118135857, 978-1118135860, 1118135865, 978-0471433316