

Question: Hi! i need help with this case. thanks! **** NO CONSIDER THE PARTS WHERE REFER A PAGE NUMBER***** Introduction A great deal of marketing is
Hi! i need help with this case. thanks!
**** NO CONSIDER THE PARTS WHERE REFER A PAGE NUMBER*****
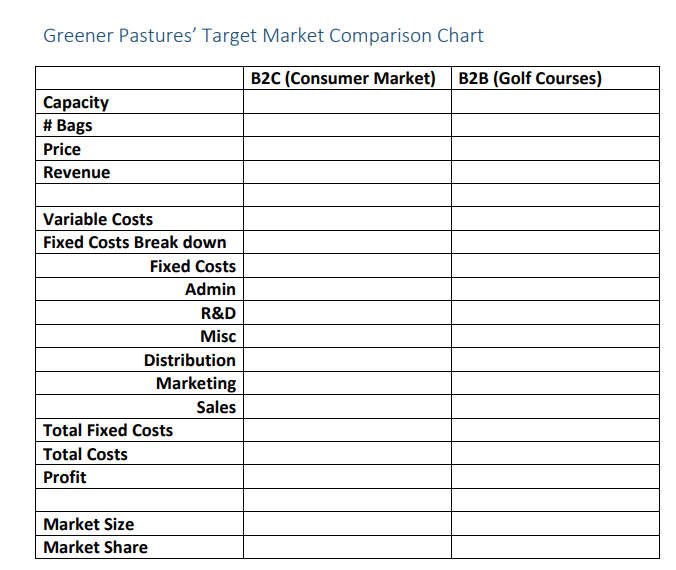
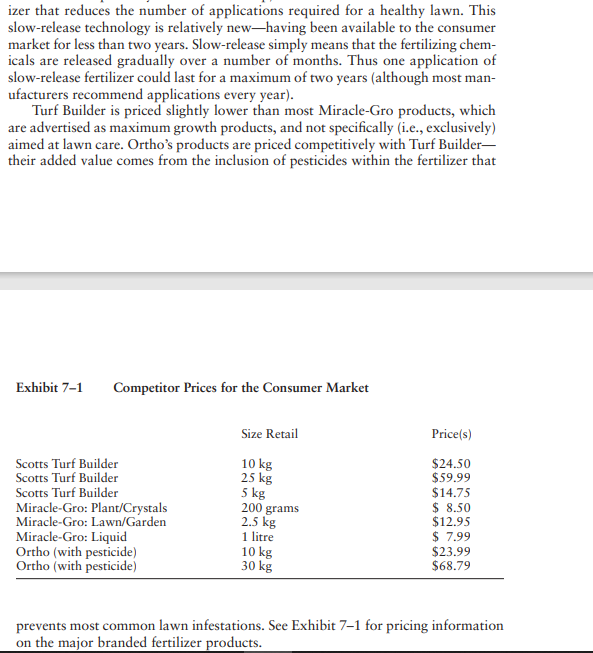
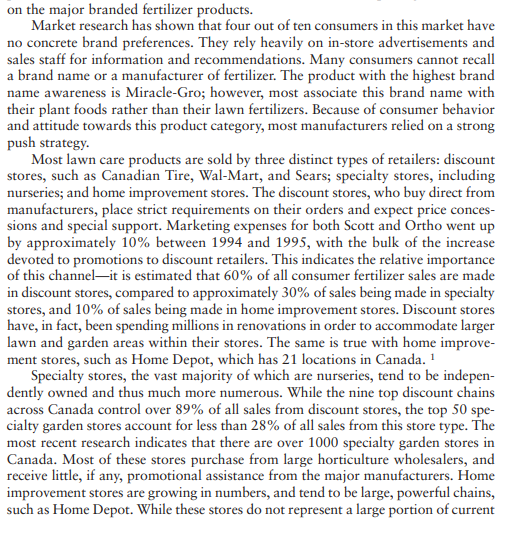
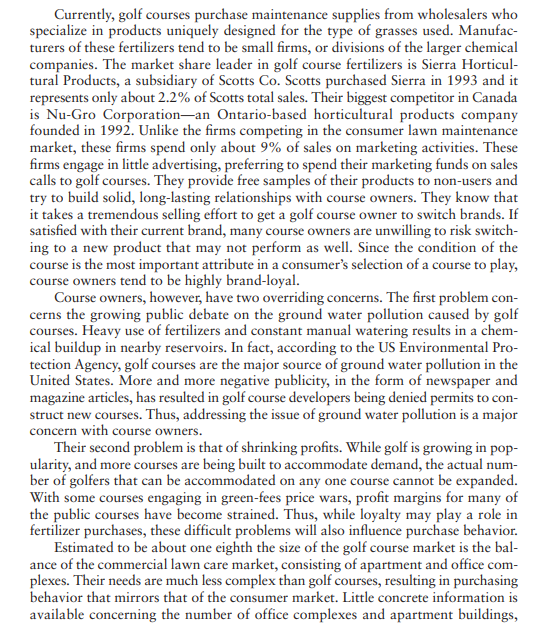
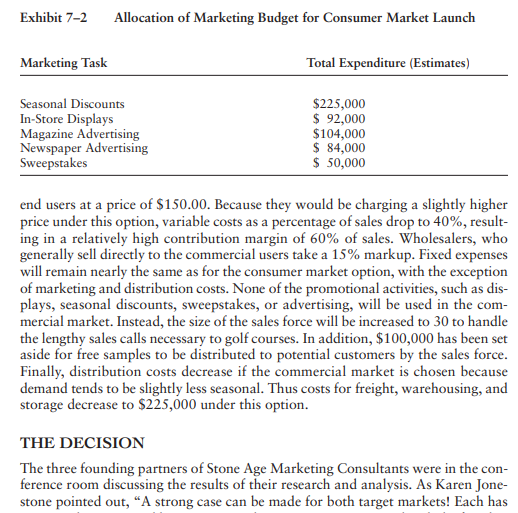
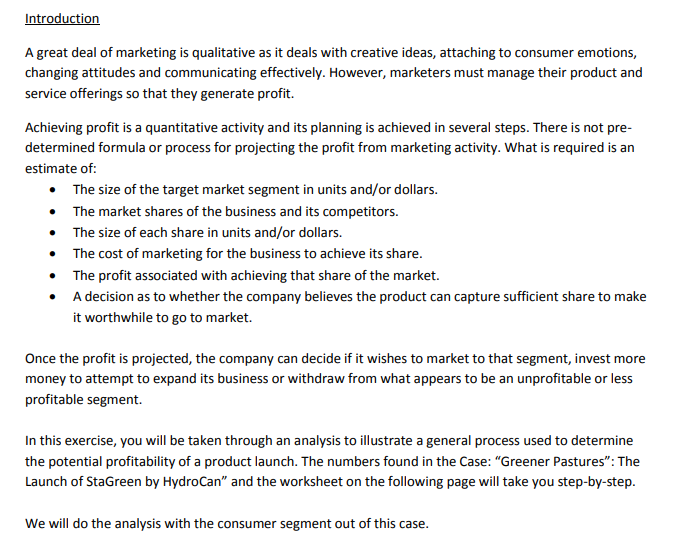
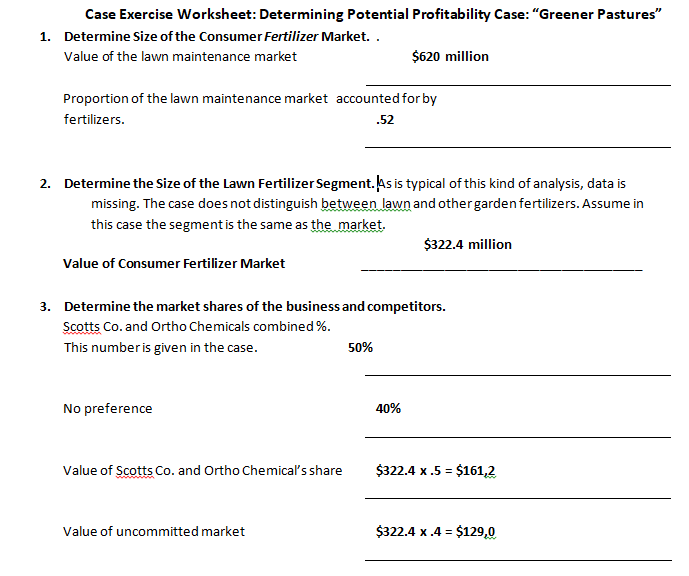
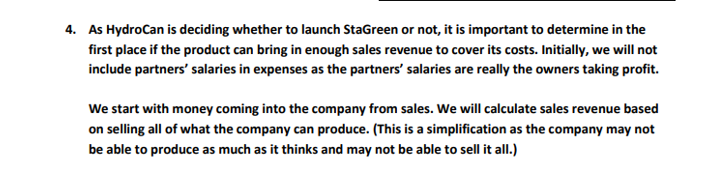
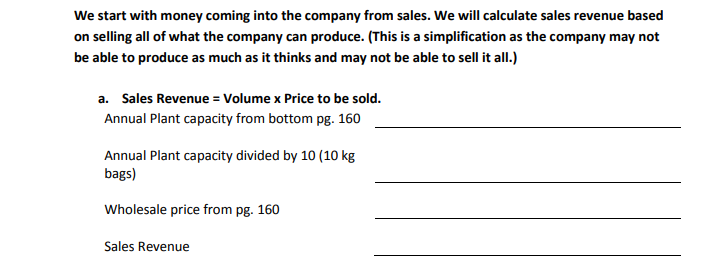
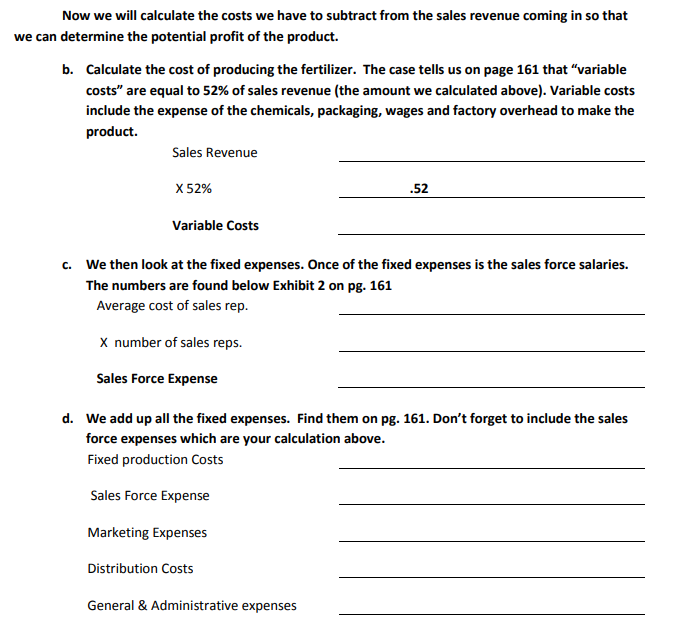
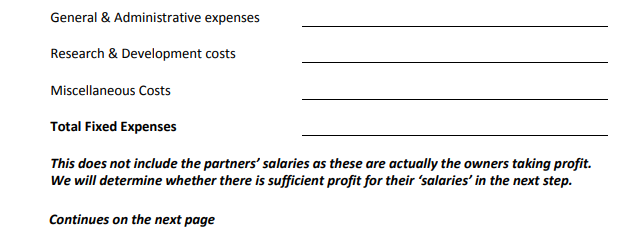
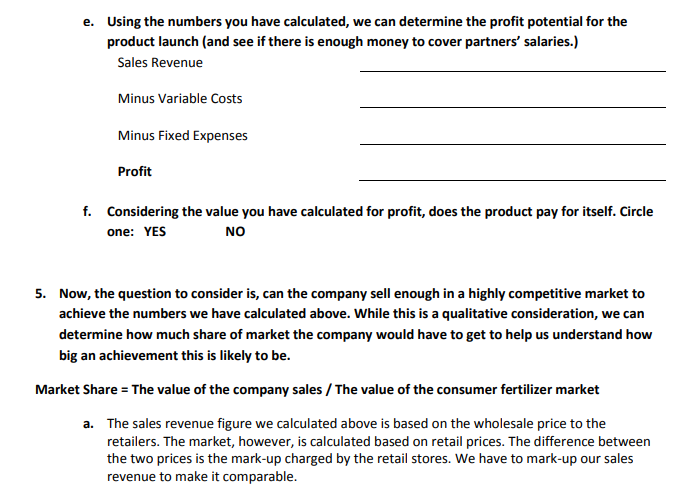
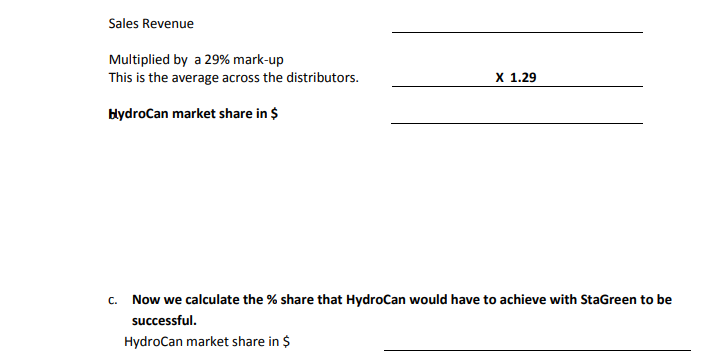
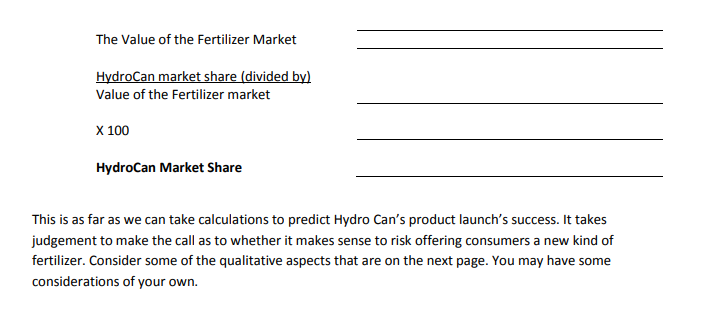
Introduction A great deal of marketing is qualitative as it deals with creative ideas, attaching to consumer emotions, changing attitudes and communicating effectively. However, marketers must manage their product and service offerings so that they generate profit. Achieving profit is a quantitative activity and its planning is achieved in several steps. There is not pre- determined formula or process for projecting the profit from marketing activity. What is required is an estimate of: The size of the target market segment in units and/or dollars. The market shares of the business and its competitors. The size of each share in units and/or dollars. The cost of marketing for the business to achieve its share. The profit associated with achieving that share of the market. A decision as to whether the company believes the product can capture sufficient share to make it worthwhile to go to market. Once the profit is projected, the company can decide if it wishes to market to that segment, invest more money to attempt to expand its business or withdraw from what appears to be an unprofitable or less profitable segment. In this exercise, you will be taken through an analysis to illustrate a general process used to determine the potential profitability of a product launch. The numbers found in the Case: "Greener Pastures": The Launch of StaGreen by HydroCan" and the worksheet on the following page will take you step-by-step. We will do the analysis with the consumer segment out of this case. Case Exercise Worksheet: Determining Potential Profitability Case: "Greener Pastures" 1. Determine Size of the Consumer Fertilizer Market. . Value of the lawn maintenance market $620 million Proportion of the lawn maintenance market accounted for by fertilizers. .52 2. Determine the size of the Lawn Fertilizer Segment. As is typical of this kind of analysis, data is missing. The case does not distinguish between lawn and other garden fertilizers. Assume in this case the segment is the same as the market. $322.4 million Value of Consumer Fertilizer Market 3. Determine the market shares of the business and competitors. Scotts Co. and Ortho Chemicals combined %. This number is given in the case. 50% No preference 40% Value of Scotts Co. and Ortho Chemical's share $322.4 x.5 = $161,2 Value of uncommitted market $322.4 x.4 = $129,0 4. As HydroCan is deciding whether to launch StaGreen or not, it is important to determine in the first place if the product can bring in enough sales revenue to cover its costs. Initially, we will not include partners' salaries in expenses as the partners' salaries are really the owners taking profit. We start with money coming into the company from sales. We will calculate sales revenue based on selling all of what the company can produce. (This is a simplification as the company may not be able to produce as much as it thinks and may not be able to sell it all.) We start with money coming into the company from sales. We will calculate sales revenue based on selling all of what the company can produce. (This is a simplification as the company may not be able to produce as much as it thinks and may not be able to sell it all.) a. Sales Revenue = Volume x Price to be sold. Annual Plant capacity from bottom pg. 160 Annual Plant capacity divided by 10 (10 kg bags) Wholesale price from pg. 160 Sales Revenue Now we will calculate the costs we have to subtract from the sales revenue coming in so that we can determine the potential profit of the product. b. Calculate the cost of producing the fertilizer. The case tells us on page 161 that variable costs" are equal to 52% of sales revenue (the amount we calculated above). Variable costs include the expense of the chemicals, packaging, wages and factory overhead to make the product. Sales Revenue X 52% .52 Variable Costs c. We then look at the fixed expenses. Once of the fixed expenses is the sales force salaries. The numbers are found below Exhibit 2 on pg. 161 Average cost of sales rep. X number of sales reps. Sales Force Expense d. We add up all the fixed expenses. Find them on pg. 161. Don't forget to include the sales force expenses which are your calculation above. Fixed production Costs Sales Force Expense Marketing Expenses Distribution Costs General & Administrative expenses General & Administrative expenses Research & Development costs Miscellaneous Costs Total Fixed Expenses This does not include the partners' salaries as these are actually the owners taking profit. We will determine whether there is sufficient profit for their 'salaries' in the next step. Continues on the next page e. Using the numbers you have calculated, we can determine the profit potential for the product launch (and see if there is enough money to cover partners' salaries.) Sales Revenue Minus Variable Costs Minus Fixed Expenses Profit f. Considering the value you have calculated for profit, does the product pay for itself. Circle one: YES NO 5. Now, the question to consider is, can the company sell enough in a highly competitive market to achieve the numbers we have calculated above. While this is a qualitative consideration, we can determine how much share of market the company would have to get to help us understand how big an achievement this is likely to be. Market Share = The value of the company sales / The value of the consumer fertilizer market a. The sales revenue figure we calculated above is based on the wholesale price to the retailers. The market, however, is calculated based on retail prices. The difference between the two prices is the mark-up charged by the retail stores. We have to mark-up our sales revenue to make it comparable. Sales Revenue Multiplied by a 29% mark-up This is the average across the distributors. X 1.29 HydroCan market share in $ C. Now we calculate the % share that HydroCan would have to achieve with StaGreen to be successful. HydroCan market share in $ The Value of the Fertilizer Market HydroCan market share (divided by) Value of the Fertilizer market X 100 HydroCan Market Share This is as far as we can take calculations to predict Hydro Can's product launch's success. It takes judgement to make the call as to whether it makes sense to risk offering consumers a new kind of fertilizer. Consider some of the qualitative aspects that are on the next page. You may have some considerations of your own. Greener Pastures' Target Market Comparison Chart B2C (Consumer Market) B2B (Golf Courses) Capacity # Bags Price Revenue Variable Costs Fixed Costs Break down Fixed Costs Admin R&D Misc Distribution Marketing Sales Total Fixed Costs Total Costs Profit Market Size Market Share C Greener Pasture hey " 7 " The Launch of StaGreenTM by HydroCan Stone Age Marketing Consultants was founded five years ago by Cari Clarkstone, Karen Jonestone, and Robert Sommerstone. Their target clients were small, start- up firms as well as medium-sized firms looking to expand operations. Their newest client, HydroCan, had a meeting scheduled for the following afternoon, and the three founders were discussing the results of their market analysis. HydroCan was a start-up company that was obtaining patents in both the US and Canada for a new type of lawn-care product. Since the company was comprised of four agricultural engineers and a financial accountant, they were in need of marketing advice con- cerning their new product StaGreen". This product, when applied to most types of grass, enabled the root system to retain water longer, thus reducing the need for both extra watering as well as frequent fertilizing. They were anxious to take this product to market; however, they desperately needed answers to several questions, including which segment to target, how to position their new product, and what type of launch strategy they should use. They approached Stone Age Marketing Con- sultants approximately four weeks ago with their needs. The marketing consultants had analyzed the markets, costs, prices, and communications options. Their last task was to formulate a comprehensive strategy for the launch of StaGreen TM. INITIAL MEETING WITH HYDROCAN During the initial meeting between Hydro Can and Stone Age, the engineers out- lined the product and its potential benefits. The product was very similar in appear- ance to most brands of common lawn fertilizer. In fact, StaGreen TM was classified This case was prepared by Anne T. Hale, visiting Assistant Professor of Marketing, Faculty of Business, Univer- sity of Victoria, Victoria, British Columbia, as a basis for class discussion. Copyright 1996 by Anne T. Hale. Reprinted with permission. "Greener Pastures," by Anne T. Hale, reprinted from Contemporary Canadian Marketing Cases, First Edition, edited by MacKenzie, 2000. Copyright 1996 by Anne T. Hale. as a chemical fertilizer with one very important difference. Its primary benefit was its effect on the root system of most of the common types of grasses used for lawns. The small pellets attached to roots and attracted and retained moisture. Extensive laboratory testing demonstrated that StaGreen TM reduced the need for manual watering on most types of grass by up to 40%. Obviously, such a product would have high demand. The first question that HydroCan needed addressed was what market to target, initially, with this product. Gary Gillis, CEO of HydroCan, wanted to target the consumer lawn and garden market as their initial target seg- ment. Carla Humphreys, on the other hand, was more inclined to target the com- mercial lawn and garden market. Since these two markets required very different launch strategies, selecting the appropriate segment was the primary concern. And, due to the fact that both Mr. Gillis and Ms. Humphreys were extremely biased towards their position, the consultants knew that they would have to present strong reasons to support their recommendation. To make this task manageable, they divided the research and analysis along the following lines: Cari Clarkstone was to investigate the viability of a consumer launch, Karen Jonestone investigated the viability of a commercial launch, and Robert Sommerstone was to obtain all nec- essary financial information. THE CONSUMER MARKET In 1995, Canadians spent nearly $2.3 billion, at the retail level, on gardening. This figure includes $945 million for grass (both sod and seed), trees, and plants; $620 million on lawn maintenance (with fertilizers accounting for 52% of the total); and $815 million on hand tools, pots, window boxes, books, magazines, land- scaping services, etc. In other words, gardening is big business in Canada. Lawn care is, however, a highly seasonal business, with 70% of sales occurring in the 2nd and 3rd fiscal quarters (i.e., April to September). According to Cari Clarkstone's research, if HydroCan was to target this seg- ment they would be competing primarily with fertilizers. The consumer fertilizer market is extremely competitive, with the top two firms, Scotts Co. and Ortho Chemicals, controlling approximately 50% of the total consumer market. Both firms are headquartered in the US (with divisional offices in Canada), and both have extensive international operations. The market share leader is Scotts Co., with their two powerful brands, Turf Builder and Miracle-Gro (acquired in May of 1995 from the privately held Stem's Group). Turf Builder is a slow-release fertil- izer that reduces the number of applications required for a healthy lawn. This izer that reduces the number of applications required for a healthy lawn. This slow-release technology is relatively newhaving been available to the consumer market for less than two years. Slow-release simply means that the fertilizing chem- icals are released gradually over a number of months. Thus one application of slow-release fertilizer could last for a maximum of two years (although most man- ufacturers recommend applications every year). Turf Builder is priced slightly lower than most Miracle-Gro products, which are advertised as maximum growth products, and not specifically (i.e., exclusively) aimed at lawn care. Ortho's products are priced competitively with Turf Builder- their added value comes from the inclusion of pesticides within the fertilizer that Exhibit 7-1 Competitor Prices for the Consumer Market Size Retail Price(s) Scotts Turf Builder Scotts Turf Builder Scotts Turf Builder Miracle-Gro: Plant/Crystals Miracle-Gro: Lawn/Garden Miracle-Gro: Liquid Ortho (with pesticide) Ortho (with pesticide) 10 kg 25 kg 5 kg 200 grams 2.5 kg 1 litre 10 kg 30 kg $24.50 $59.99 $14.75 $ 8.50 $12.95 $ 7.99 $23.99 $68.79 prevents most common lawn infestations. See Exhibit 7-1 for pricing information on the major branded fertilizer products. on the major branded fertilizer products. Market research has shown that four out of ten consumers in this market have no concrete brand preferences. They rely heavily on in-store advertisements and sales staff for information and recommendations. Many consumers cannot recall a brand name or a manufacturer of fertilizer. The product with the highest brand name awareness is Miracle-Gro; however, most associate this brand name with their plant foods rather than their lawn fertilizers. Because of consumer behavior and attitude towards this product category, most manufacturers relied on a strong push strategy. Most lawn care products are sold by three distinct types of retailers: discount stores, such as Canadian Tire, Wal-Mart, and Sears; specialty stores, including nurseries; and home improvement stores. The discount stores, who buy direct from manufacturers, place strict requirements on their orders and expect price conces- sions and special support. Marketing expenses for both Scott and Ortho went up by approximately 10% between 1994 and 1995, with the bulk of the increase devoted to promotions to discount retailers. This indicates the relative importance of this channelit is estimated that 60% of all consumer fertilizer sales are made in discount stores, compared to approximately 30% of sales being made in specialty stores, and 10% of sales being made in home improvement stores. Discount stores have, in fact, been spending millions in renovations in order to accommodate larger lawn and garden areas within their stores. The same is true with home improve- ment stores, such as Home Depot, which has 21 locations in Canada. 1 Specialty stores, the vast majority of which are nurseries, tend to be indepen- dently owned and thus much more numerous. While the nine top discount chains across Canada control over 89% of all sales from discount stores, the top 50 spe- cialty garden stores account for less than 28% of all sales from this store type. The most recent research indicates that there are over 1000 specialty garden stores in Canada. Most of these stores purchase from large horticulture wholesalers, and receive little, if any, promotional assistance from the major manufacturers. Home improvement stores are growing in numbers, and tend to be large, powerful chains, such as Home Depot. While these stores do not represent a large portion of current sales, they are expected to grow in importance. Like discount stores, home improve- ment stores buy direct from the manufacturers and require price concessions and pro- motional support. The large manufacturers of fertilizer products generally spend approximately 20% of sales on marketing activities. The bulk of this money goes towards the sales force, and selling in general, and trade promotions. Due to the three differ- ent channels in which their product is sold, most fertilizer manufacturers recognize the importance of a strong sales force. In terms of trade promotions, they provide in-store literature, displays, and sales trainingespecially to the large discount stores and the home improvement stores. Less important is advertising. Miracle- Gro is the most heavily advertised brand on the market, and they generally spend 4% of sales on advertising (which probably accounts for the high brand name awareness). Scotts advertises Turf Builder, but only during the early spring when demand for lawn fertilizers is at its peak. Most companies run their advertisements for their existing brands and any new brands they may be launching during the spring and early summer months. Thus, advertising expenditures are generally at their highest in March, April, May, and June, and zero at all other times. Only Miracle-Gro is advertised year-round, with different messages at different times of the year. For example, Miracle-Gro advertises its benefits for house plants dur- ing the winter months, and its benefits for fruits, vegetables, and flowers during the spring and summer months. THE COMMERCIAL MARKET The commercial market consists primarily of Canada's 1800 golf courses, but also includes commercial properties such as office complexes and apartment buildings. The most lucrative market, however, is golf courses. Currently under fire for being a major source of ground water pollution, due to the high and frequent levels of fertilizers used to keep courses green, most owners are actively looking for ways to cut both water and fertilizer usage. Course owners spend, on average, $300,000 to maintain their golf course during the year, of which 42% represents water usage costs and 24% represents fertilizer purchases. For extremely large, complex courses, this figure can run as high as $800,000, and for smaller inner-city public courses, as low as $104,000. Tests have indicated that StaGreen" will reduce water usage by one half and fertilizer usage by one third. This is the primary reason why Ms. Humphreys was so adamant that the company select the commercial market as their primary target market. The game of golf has been enjoying a renewed popularity after a drastic decrease in participation during the 1980s. The growing number of public courses with reasonable fees, the continued aging of the Canadian population, and the development of better equipment have all contributed to this growth in popular- ity. It is estimated that the number of golf courses will increase by 22% to 2200 by the end of this decade. Most golf courses are independently owned and oper- ated. Only 4% of all courses are owned by a company that owns more then one course. Courses are dispersed throughout Canada, but British Columbia, and Van- couver in particular, boast the highest number of courses. Currently, golf courses purchase maintenance supplies from wholesalers who specialize in products uniquely designed for the type of grasses used. Manufac- turers of these fertilizers tend to be small firms, or divisions of the larger chemical companies. The market share leader in golf course fertilizers is Sierra Horticul- tural Products, a subsidiary of Scotts Co. Scotts purchased Sierra in 1993 and it represents only about 2.2% of Scotts total sales. Their biggest competitor in Canada is Nu-Gro Corporation-an Ontario-based horticultural products company founded in 1992. Unlike the firms competing in the consumer lawn maintenance market, these firms spend only about 9% of sales on marketing activities. These firms engage in little advertising, preferring to spend their marketing funds on sales calls to golf courses. They provide free samples of their products to non-users and try to build solid, long-lasting relationships with course owners. They know that it takes a tremendous selling effort to get a golf course owner to switch brands. If satisfied with their current brand, many course owners are unwilling to risk switch- ing to a new product that may not perform as well. Since the condition of the course is the most important attribute in a consumer's selection of a course to play, course owners tend to be highly brand-loyal. Course owners, however, have two overriding concerns. The first problem con- cerns the growing public debate on the ground water pollution caused by golf courses. Heavy use of fertilizers and constant manual watering results in a chem- ical buildup in nearby reservoirs. In fact, according to the US Environmental Pro- tection Agency, golf courses are the major source of ground water pollution in the United States. More and more negative publicity, in the form of newspaper and magazine articles, has resulted in golf course developers being denied permits to con- struct new courses. Thus, addressing the issue of ground water pollution is a major concern with course owners. Their second problem is that of shrinking profits. While golf is growing in pop- ularity, and more courses are being built to accommodate demand, the actual num- ber of golfers that can be accommodated on any one course cannot be expanded. With some courses engaging in green-fees price wars, profit margins for many of the public courses have become strained. Thus, while loyalty may play a role in fertilizer purchases, these difficult problems will also influence purchase behavior. Estimated to be about one eighth the size of the golf course market is the bal- ance of the commercial lawn care market, consisting of apartment and office com- plexes. Their needs are much less complex than golf courses, resulting in purchasing behavior that mirrors that of the consumer market. Little concrete information is available concerning the number of office complexes and apartment buildings, although estimates have put the total figure around 2900, of which 16.5% repre- sent multiple holdings by one corporation. These commercial real estate property firms spend a disproportionate amount on lawn maintenancethey account for nearly 26% of the total dollars spent in this sector of the commercial maintenance market. This sector of the commercial market tends to purchase in bulk through wholesalers-generally the same wholesalers who service the specialty stores in the consumer market. HYDROCAN HydroCan was incorporated nearly one year ago. They have leased their produc- tion facilities, and have purchased and/or leased all of the equipment and machin- ery necessary for use in the production of StaGreenTM. Their production facility has the capacity to produce 180,000 kilogram of StaGreenTM per month. The owners of Hydro Can have suggested a quality/value-added pricing strategy. They believe that they have a superior product that will save the end user both time and money, due to the reduced need for fertilizer products and reduced need for manual water- ing. The founders of HydroCan outlined their ideas for the launch year marketing strategy for both the consumer and the commercial lawn-care markets. If HydroCan elects to target the consumer market, they will package Sta- Green in a 10 kilogram bag, which market research indicates was the most pop- ular size with consumers. They will set their price to trade (i.e., wholesalers and retailers) at $22.50, with their variable costs representing 52% of sales. On aver- age, the large discount stores and home improvement stores take a 25% markup on lawn maintenance products. The smaller specialty stores take a larger markup of $35%. Wholesalers (if used) take a 15% markup. Fixed production costs include $700,000 in annual rental (for the site and the equipment), general and adminis- trative expenses of $80,200, research and development expenses of $20,650, and miscellaneous expenses of $12,350. Distribution costs (including freight, ware- housing, and storage) represented a significant yearly expense due to the seasonal nature of demand. Production of StaGreenTM would be continuous year round, how- ever, sales would be highly concentrated in the months of April through September. This means that the company would have relatively high distribution costs, estimated to be $426,000 per year. Not yet included in any of their financial statements are the salaries for the four founding partners of Hydro Can. They would like to earn $50,000 per year (each), but are willing to forego their salary in the launch year. Their marketing budget has been set at $555,000, and HydroCan has sug- gested this amount be allocated to the various tasks, as shown in Exhibit 7-2. Sea- sonal discounts are price discounts offered to retailers and wholesalers as an incentive to purchase well in advance of the peak selling season. HydroCan plans to offer these discounts, estimated to be 20% off the trade price for each bag pur- chased, to wholesalers and retailers in the months of November and December as a method to reduce warehouse and storage costs. The displays will cost approxi- mately $250.00 each (which includes promotional materials, such as brochures), and will be furnished to discount stores, home improvement stores, and as many nurseries as possible. The sweepstakes is used to increase awareness and interest Exhibit 7-2 Allocation of Marketing Budget for Consumer Market Launch Marketing Task Total Expenditure (Estimates) Seasonal Discounts In-Store Displays Magazine Advertising Newspaper Advertising Sweepstakes $225,000 $ 92,000 $104,000 $ 84,000 $ 50,000 end users at a price of $150.00. Because they would be charging a slightly higher price under this option, variable costs as a percentage of sales drop to 40%, result- ing in a relatively high contribution margin of 60% of sales. Wholesalers, who generally sell directly to the commercial users take a 15% markup. Fixed expenses will remain nearly the same as for the consumer market option, with the exception of marketing and distribution costs. None of the promotional activities, such as dis- plays, seasonal discounts, sweepstakes, or advertising, will be used in the com- mercial market. Instead, the size of the sales force will be increased to 30 to handle the lengthy sales calls necessary to golf courses. In addition, $100,000 has been set aside for free samples to be distributed to potential customers by the sales force. Finally, distribution costs decrease if the commercial market is chosen because demand tends to be slightly less seasonal. Thus costs for freight, warehousing, and storage decrease to $225,000 under this option. THE DECISION The three founding partners of Stone Age Marketing Consultants were in the con- ference room discussing the results of their research and analysis. As Karen Jone- stone pointed out, A strong case can be made for both target markets! Each has its own advantages and limitations." Rob Sommerstone countered with the fact that HydroCan was a start-up business. Their financial resources are extremely lim- ited right now. They cannot increase their production capacity for at least two years, and if they hope to acquire expansion capital to increase their total capac- ity, they need to show a profit as early as possible. Cari Clarkstone was consid- ering a more creative solutiontargeting selected parts of either or both the consumer and commercial markets. Before the group could begin to assess the via- bility of HydroCan and its product, StaGreenTM, they had to decide on which mar- ket to target, how to position StaGreenTM in that target market, and then they had to develop a viable marketing strategy for the launch year. The final pressure for the group was the fact that HydroCan needed to launch in Februaryjust prior to the peak selling seasonthus the consultants knew there was no time to acquire additional market research. The decision had to be based on the information at hand. Endnote 1. Source: Maclean's, Volume 109, April 22, 1996, pages 62-63. Introduction A great deal of marketing is qualitative as it deals with creative ideas, attaching to consumer emotions, changing attitudes and communicating effectively. However, marketers must manage their product and service offerings so that they generate profit. Achieving profit is a quantitative activity and its planning is achieved in several steps. There is not pre- determined formula or process for projecting the profit from marketing activity. What is required is an estimate of: The size of the target market segment in units and/or dollars. The market shares of the business and its competitors. The size of each share in units and/or dollars. The cost of marketing for the business to achieve its share. The profit associated with achieving that share of the market. A decision as to whether the company believes the product can capture sufficient share to make it worthwhile to go to market. Once the profit is projected, the company can decide if it wishes to market to that segment, invest more money to attempt to expand its business or withdraw from what appears to be an unprofitable or less profitable segment. In this exercise, you will be taken through an analysis to illustrate a general process used to determine the potential profitability of a product launch. The numbers found in the Case: "Greener Pastures": The Launch of StaGreen by HydroCan" and the worksheet on the following page will take you step-by-step. We will do the analysis with the consumer segment out of this case. Case Exercise Worksheet: Determining Potential Profitability Case: "Greener Pastures" 1. Determine Size of the Consumer Fertilizer Market. . Value of the lawn maintenance market $620 million Proportion of the lawn maintenance market accounted for by fertilizers. .52 2. Determine the size of the Lawn Fertilizer Segment. As is typical of this kind of analysis, data is missing. The case does not distinguish between lawn and other garden fertilizers. Assume in this case the segment is the same as the market. $322.4 million Value of Consumer Fertilizer Market 3. Determine the market shares of the business and competitors. Scotts Co. and Ortho Chemicals combined %. This number is given in the case. 50% No preference 40% Value of Scotts Co. and Ortho Chemical's share $322.4 x.5 = $161,2 Value of uncommitted market $322.4 x.4 = $129,0 4. As HydroCan is deciding whether to launch StaGreen or not, it is important to determine in the first place if the product can bring in enough sales revenue to cover its costs. Initially, we will not include partners' salaries in expenses as the partners' salaries are really the owners taking profit. We start with money coming into the company from sales. We will calculate sales revenue based on selling all of what the company can produce. (This is a simplification as the company may not be able to produce as much as it thinks and may not be able to sell it all.) We start with money coming into the company from sales. We will calculate sales revenue based on selling all of what the company can produce. (This is a simplification as the company may not be able to produce as much as it thinks and may not be able to sell it all.) a. Sales Revenue = Volume x Price to be sold. Annual Plant capacity from bottom pg. 160 Annual Plant capacity divided by 10 (10 kg bags) Wholesale price from pg. 160 Sales Revenue Now we will calculate the costs we have to subtract from the sales revenue coming in so that we can determine the potential profit of the product. b. Calculate the cost of producing the fertilizer. The case tells us on page 161 that variable costs" are equal to 52% of sales revenue (the amount we calculated above). Variable costs include the expense of the chemicals, packaging, wages and factory overhead to make the product. Sales Revenue X 52% .52 Variable Costs c. We then look at the fixed expenses. Once of the fixed expenses is the sales force salaries. The numbers are found below Exhibit 2 on pg. 161 Average cost of sales rep. X number of sales reps. Sales Force Expense d. We add up all the fixed expenses. Find them on pg. 161. Don't forget to include the sales force expenses which are your calculation above. Fixed production Costs Sales Force Expense Marketing Expenses Distribution Costs General & Administrative expenses General & Administrative expenses Research & Development costs Miscellaneous Costs Total Fixed Expenses This does not include the partners' salaries as these are actually the owners taking profit. We will determine whether there is sufficient profit for their 'salaries' in the next step. Continues on the next page e. Using the numbers you have calculated, we can determine the profit potential for the product launch (and see if there is enough money to cover partners' salaries.) Sales Revenue Minus Variable Costs Minus Fixed Expenses Profit f. Considering the value you have calculated for profit, does the product pay for itself. Circle one: YES NO 5. Now, the question to consider is, can the company sell enough in a highly competitive market to achieve the numbers we have calculated above. While this is a qualitative consideration, we can determine how much share of market the company would have to get to help us understand how big an achievement this is likely to be. Market Share = The value of the company sales / The value of the consumer fertilizer market a. The sales revenue figure we calculated above is based on the wholesale price to the retailers. The market, however, is calculated based on retail prices. The difference between the two prices is the mark-up charged by the retail stores. We have to mark-up our sales revenue to make it comparable. Sales Revenue Multiplied by a 29% mark-up This is the average across the distributors. X 1.29 HydroCan market share in $ C. Now we calculate the % share that HydroCan would have to achieve with StaGreen to be successful. HydroCan market share in $ The Value of the Fertilizer Market HydroCan market share (divided by) Value of the Fertilizer market X 100 HydroCan Market Share This is as far as we can take calculations to predict Hydro Can's product launch's success. It takes judgement to make the call as to whether it makes sense to risk offering consumers a new kind of fertilizer. Consider some of the qualitative aspects that are on the next page. You may have some considerations of your own. Greener Pastures' Target Market Comparison Chart B2C (Consumer Market) B2B (Golf Courses) Capacity # Bags Price Revenue Variable Costs Fixed Costs Break down Fixed Costs Admin R&D Misc Distribution Marketing Sales Total Fixed Costs Total Costs Profit Market Size Market Share C Greener Pasture hey " 7 " The Launch of StaGreenTM by HydroCan Stone Age Marketing Consultants was founded five years ago by Cari Clarkstone, Karen Jonestone, and Robert Sommerstone. Their target clients were small, start- up firms as well as medium-sized firms looking to expand operations. Their newest client, HydroCan, had a meeting scheduled for the following afternoon, and the three founders were discussing the results of their market analysis. HydroCan was a start-up company that was obtaining patents in both the US and Canada for a new type of lawn-care product. Since the company was comprised of four agricultural engineers and a financial accountant, they were in need of marketing advice con- cerning their new product StaGreen". This product, when applied to most types of grass, enabled the root system to retain water longer, thus reducing the need for both extra watering as well as frequent fertilizing. They were anxious to take this product to market; however, they desperately needed answers to several questions, including which segment to target, how to position their new product, and what type of launch strategy they should use. They approached Stone Age Marketing Con- sultants approximately four weeks ago with their needs. The marketing consultants had analyzed the markets, costs, prices, and communications options. Their last task was to formulate a comprehensive strategy for the launch of StaGreen TM. INITIAL MEETING WITH HYDROCAN During the initial meeting between Hydro Can and Stone Age, the engineers out- lined the product and its potential benefits. The product was very similar in appear- ance to most brands of common lawn fertilizer. In fact, StaGreen TM was classified This case was prepared by Anne T. Hale, visiting Assistant Professor of Marketing, Faculty of Business, Univer- sity of Victoria, Victoria, British Columbia, as a basis for class discussion. Copyright 1996 by Anne T. Hale. Reprinted with permission. "Greener Pastures," by Anne T. Hale, reprinted from Contemporary Canadian Marketing Cases, First Edition, edited by MacKenzie, 2000. Copyright 1996 by Anne T. Hale. as a chemical fertilizer with one very important difference. Its primary benefit was its effect on the root system of most of the common types of grasses used for lawns. The small pellets attached to roots and attracted and retained moisture. Extensive laboratory testing demonstrated that StaGreen TM reduced the need for manual watering on most types of grass by up to 40%. Obviously, such a product would have high demand. The first question that HydroCan needed addressed was what market to target, initially, with this product. Gary Gillis, CEO of HydroCan, wanted to target the consumer lawn and garden market as their initial target seg- ment. Carla Humphreys, on the other hand, was more inclined to target the com- mercial lawn and garden market. Since these two markets required very different launch strategies, selecting the appropriate segment was the primary concern. And, due to the fact that both Mr. Gillis and Ms. Humphreys were extremely biased towards their position, the consultants knew that they would have to present strong reasons to support their recommendation. To make this task manageable, they divided the research and analysis along the following lines: Cari Clarkstone was to investigate the viability of a consumer launch, Karen Jonestone investigated the viability of a commercial launch, and Robert Sommerstone was to obtain all nec- essary financial information. THE CONSUMER MARKET In 1995, Canadians spent nearly $2.3 billion, at the retail level, on gardening. This figure includes $945 million for grass (both sod and seed), trees, and plants; $620 million on lawn maintenance (with fertilizers accounting for 52% of the total); and $815 million on hand tools, pots, window boxes, books, magazines, land- scaping services, etc. In other words, gardening is big business in Canada. Lawn care is, however, a highly seasonal business, with 70% of sales occurring in the 2nd and 3rd fiscal quarters (i.e., April to September). According to Cari Clarkstone's research, if HydroCan was to target this seg- ment they would be competing primarily with fertilizers. The consumer fertilizer market is extremely competitive, with the top two firms, Scotts Co. and Ortho Chemicals, controlling approximately 50% of the total consumer market. Both firms are headquartered in the US (with divisional offices in Canada), and both have extensive international operations. The market share leader is Scotts Co., with their two powerful brands, Turf Builder and Miracle-Gro (acquired in May of 1995 from the privately held Stem's Group). Turf Builder is a slow-release fertil- izer that reduces the number of applications required for a healthy lawn. This izer that reduces the number of applications required for a healthy lawn. This slow-release technology is relatively newhaving been available to the consumer market for less than two years. Slow-release simply means that the fertilizing chem- icals are released gradually over a number of months. Thus one application of slow-release fertilizer could last for a maximum of two years (although most man- ufacturers recommend applications every year). Turf Builder is priced slightly lower than most Miracle-Gro products, which are advertised as maximum growth products, and not specifically (i.e., exclusively) aimed at lawn care. Ortho's products are priced competitively with Turf Builder- their added value comes from the inclusion of pesticides within the fertilizer that Exhibit 7-1 Competitor Prices for the Consumer Market Size Retail Price(s) Scotts Turf Builder Scotts Turf Builder Scotts Turf Builder Miracle-Gro: Plant/Crystals Miracle-Gro: Lawn/Garden Miracle-Gro: Liquid Ortho (with pesticide) Ortho (with pesticide) 10 kg 25 kg 5 kg 200 grams 2.5 kg 1 litre 10 kg 30 kg $24.50 $59.99 $14.75 $ 8.50 $12.95 $ 7.99 $23.99 $68.79 prevents most common lawn infestations. See Exhibit 7-1 for pricing information on the major branded fertilizer products. on the major branded fertilizer products. Market research has shown that four out of ten consumers in this market have no concrete brand preferences. They rely heavily on in-store advertisements and sales staff for information and recommendations. Many consumers cannot recall a brand name or a manufacturer of fertilizer. The product with the highest brand name awareness is Miracle-Gro; however, most associate this brand name with their plant foods rather than their lawn fertilizers. Because of consumer behavior and attitude towards this product category, most manufacturers relied on a strong push strategy. Most lawn care products are sold by three distinct types of retailers: discount stores, such as Canadian Tire, Wal-Mart, and Sears; specialty stores, including nurseries; and home improvement stores. The discount stores, who buy direct from manufacturers, place strict requirements on their orders and expect price conces- sions and special support. Marketing expenses for both Scott and Ortho went up by approximately 10% between 1994 and 1995, with the bulk of the increase devoted to promotions to discount retailers. This indicates the relative importance of this channelit is estimated that 60% of all consumer fertilizer sales are made in discount stores, compared to approximately 30% of sales being made in specialty stores, and 10% of sales being made in home improvement stores. Discount stores have, in fact, been spending millions in renovations in order to accommodate larger lawn and garden areas within their stores. The same is true with home improve- ment stores, such as Home Depot, which has 21 locations in Canada. 1 Specialty stores, the vast majority of which are nurseries, tend to be indepen- dently owned and thus much more numerous. While the nine top discount chains across Canada control over 89% of all sales from discount stores, the top 50 spe- cialty garden stores account for less than 28% of all sales from this store type. The most recent research indicates that there are over 1000 specialty garden stores in Canada. Most of these stores purchase from large horticulture wholesalers, and receive little, if any, promotional assistance from the major manufacturers. Home improvement stores are growing in numbers, and tend to be large, powerful chains, such as Home Depot. While these stores do not represent a large portion of current sales, they are expected to grow in importance. Like discount stores, home improve- ment stores buy direct from the manufacturers and require price concessions and pro- motional support. The large manufacturers of fertilizer products generally spend approximately 20% of sales on marketing activities. The bulk of this money goes towards the sales force, and selling in general, and trade promotions. Due to the three differ- ent channels in which their product is sold, most fertilizer manufacturers recognize the importance of a strong sales force. In terms of trade promotions, they provide in-store literature, displays, and sales trainingespecially to the large discount stores and the home improvement stores. Less important is advertising. Miracle- Gro is the most heavily advertised brand on the market, and they generally spend 4% of sales on advertising (which probably accounts for the high brand name awareness). Scotts advertises Turf Builder, but only during the early spring when demand for lawn fertilizers is at its peak. Most companies run their advertisements for their existing brands and any new brands they may be launching during the spring and early summer months. Thus, advertising expenditures are generally at their highest in March, April, May, and June, and zero at all other times. Only Miracle-Gro is advertised year-round, with different messages at different times of the year. For example, Miracle-Gro advertises its benefits for house plants dur- ing the winter months, and its benefits for fruits, vegetables, and flowers during the spring and summer months. THE COMMERCIAL MARKET The commercial market consists primarily of Canada's 1800 golf courses, but also includes commercial properties such as office complexes and apartment buildings. The most lucrative market, however, is golf courses. Currently under fire for being a major source of ground water pollution, due to the high and frequent levels of fertilizers used to keep courses green, most owners are actively looking for ways to cut both water and fertilizer usage. Course owners spend, on average, $300,000 to maintain their golf course during the year, of which 42% represents water usage costs and 24% represents fertilizer purchases. For extremely large, complex courses, this figure can run as high as $800,000, and for smaller inner-city public courses, as low as $104,000. Tests have indicated that StaGreen" will reduce water usage by one half and fertilizer usage by one third. This is the primary reason why Ms. Humphreys was so adamant that the company select the commercial market as their primary target market. The game of golf has been enjoying a renewed popularity after a drastic decrease in participation during the 1980s. The growing number of public courses with reasonable fees, the continued aging of the Canadian population, and the development of better equipment have all contributed to this growth in popular- ity. It is estimated that the number of golf courses will increase by 22% to 2200 by the end of this decade. Most golf courses are independently owned and oper- ated. Only 4% of all courses are owned by a company that owns more then one course. Courses are dispersed throughout Canada, but British Columbia, and Van- couver in particular, boast the highest number of courses. Currently, golf courses purchase maintenance supplies from wholesalers who specialize in products uniquely designed for the type of grasses used. Manufac- turers of these fertilizers tend to be small firms, or divisions of the larger chemical companies. The market share leader in golf course fertilizers is Sierra Horticul- tural Products, a subsidiary of Scotts Co. Scotts purchased Sierra in 1993 and it represents only about 2.2% of Scotts total sales. Their biggest competitor in Canada is Nu-Gro Corporation-an Ontario-based horticultural products company founded in 1992. Unlike the firms competing in the consumer lawn maintenance market, these firms spend only about 9% of sales on marketing activities. These firms engage in little advertising, preferring to spend their marketing funds on sales calls to golf courses. They provide free samples of their products to non-users and try to build solid, long-lasting relationships with course owners. They know that it takes a tremendous selling effort to get a golf course owner to switch brands. If satisfied with their current brand, many course owners are unwilling to risk switch- ing to a new product that may not perform as well. Since the condition of the course is the most important attribute in a consumer's selection of a course to play, course owners tend to be highly brand-loyal. Course owners, however, have two overriding concerns. The first problem con- cerns the growing public debate on the ground water pollution caused by golf courses. Heavy use of fertilizers and constant manual watering results in a chem- ical buildup in nearby reservoirs. In fact, according to the US Environmental Pro- tection Agency, golf courses are the major source of ground water pollution in the United States. More and more negative publicity, in the form of newspaper and magazine articles, has resulted in golf course developers being denied permits to con- struct new courses. Thus, addressing the issue of ground water pollution is a major concern with course owners. Their second problem is that of shrinking profits. While golf is growing in pop- ularity, and more courses are being built to accommodate demand, the actual num- ber of golfers that can be accommodated on any one course cannot be expanded. With some courses engaging in green-fees price wars, profit margins for many of the public courses have become strained. Thus, while loyalty may play a role in fertilizer purchases, these difficult problems will also influence purchase behavior. Estimated to be about one eighth the size of the golf course market is the bal- ance of the commercial lawn care market, consisting of apartment and office com- plexes. Their needs are much less complex than golf courses, resulting in purchasing behavior that mirrors that of the consumer market. Little concrete information is available concerning the number of office complexes and apartment buildings, although estimates have put the total figure around 2900, of which 16.5% repre- sent multiple holdings by one corporation. These commercial real estate property firms spend a disproportionate amount on lawn maintenancethey account for nearly 26% of the total dollars spent in this sector of the commercial maintenance market. This sector of the commercial market tends to purchase in bulk through wholesalers-generally the same wholesalers who service the specialty stores in the consumer market. HYDROCAN HydroCan was incorporated nearly one year ago. They have leased their produc- tion facilities, and have purchased and/or leased all of the equipment and machin- ery necessary for use in the production of StaGreenTM. Their production facility has the capacity to produce 180,000 kilogram of StaGreenTM per month. The owners of Hydro Can have suggested a quality/value-added pricing strategy. They believe that they have a superior product that will save the end user both time and money, due to the reduced need for fertilizer products and reduced need for manual water- ing. The founders of HydroCan outlined their ideas for the launch year marketing strategy for both the consumer and the commercial lawn-care markets. If HydroCan elects to target the consumer market, they will package Sta- Green in a 10 kilogram bag, which market research indicates was the most pop- ular size with consumers. They will set their price to trade (i.e., wholesalers and retailers) at $22.50, with their variable costs representing 52% of sales. On aver- age, the large discount stores and home improvement stores take a 25% markup on lawn maintenance products. The smaller specialty stores take a larger markup of $35%. Wholesalers (if used) take a 15% markup. Fixed production costs include $700,000 in annual rental (for the site and the equipment), general and adminis- trative expenses of $80,200, research and development expenses of $20,650, and miscellaneous expenses of $12,350. Distribution costs (including freight, ware- housing, and storage) represented a significant yearly expense due to the seasonal nature of demand. Production of StaGreenTM would be continuous year round, how- ever, sales would be highly concentrated in the months of April through September. This means that the company would have relatively high distribution costs, estimated to be $426,000 per year. Not yet included in any of their financial statements are the salaries for the four founding partners of Hydro Can. They would like to earn $50,000 per year (each), but are willing to forego their salary in the launch year. Their marketing budget has been set at $555,000, and HydroCan has sug- gested this amount be allocated to the various tasks, as shown in Exhibit 7-2. Sea- sonal discounts are price discounts offered to retailers and wholesalers as an incentive to purchase well in advance of the peak selling season. HydroCan plans to offer these discounts, estimated to be 20% off the trade price for each bag pur- chased, to wholesalers and retailers in the months of November and December as a method to reduce warehouse and storage costs. The displays will cost approxi- mately $250.00 each (which includes promotional materials, such as brochures), and will be furnished to discount stores, home improvement stores, and as many nurseries as possible. The sweepstakes is used to increase awareness and interest Exhibit 7-2 Allocation of Marketing Budget for Consumer Market Launch Marketing Task Total Expenditure (Estimates) Seasonal Discounts In-Store Displays Magazine Advertising Newspaper Advertising Sweepstakes $225,000 $ 92,000 $104,000 $ 84,000 $ 50,000 end users at a price of $150.00. Because they would be charging a slightly higher price under this option, variable costs as a percentage of sales drop to 40%, result- ing in a relatively high contribution margin of 60% of sales. Wholesalers, who generally sell directly to the commercial users take a 15% markup. Fixed expenses will remain nearly the same as for the consumer market option, with the exception of marketing and distribution costs. None of the promotional activities, such as dis- plays, seasonal discounts, sweepstakes, or advertising, will be used in the com- mercial market. Instead, the size of the sales force will be increased to 30 to handle the lengthy sales calls necessary to golf courses. In addition, $100,000 has been set aside for free samples to be distributed to potential customers by the sales force. Finally, distribution costs decrease if the commercial market is chosen because demand tends to be slightly less seasonal. Thus costs for freight, warehousing, and storage decrease to $225,000 under this option. THE DECISION The three founding partners of Stone Age Marketing Consultants were in the con- ference room discussing the results of their research and analysis. As Karen Jone- stone pointed out, A strong case can be made for both target markets! Each has its own advantages and limitations." Rob Sommerstone countered with the fact that HydroCan was a start-up business. Their financial resources are extremely lim- ited right now. They cannot increase their production capacity for at least two years, and if they hope to acquire expansion capital to increase their total capac- ity, they need to show a profit as early as possible. Cari Clarkstone was consid- ering a more creative solutiontargeting selected parts of either or both the consumer and commercial markets. Before the group could begin to assess the via- bility of HydroCan and its product, StaGreenTM, they had to decide on which mar- ket to target, how to position StaGreenTM in that target market, and then they had to develop a viable marketing strategy for the launch year. The final pressure for the group was the fact that HydroCan needed to launch in Februaryjust prior to the peak selling seasonthus the consultants knew there was no time to acquire additional market research. The decision had to be based on the information at hand. Endnote 1. Source: Maclean's, Volume 109, April 22, 1996, pages 62-63
Step by Step Solution
There are 3 Steps involved in it

Get step-by-step solutions from verified subject matter experts