Hi
I need please an answer for this homework as soon as possible
Best regards
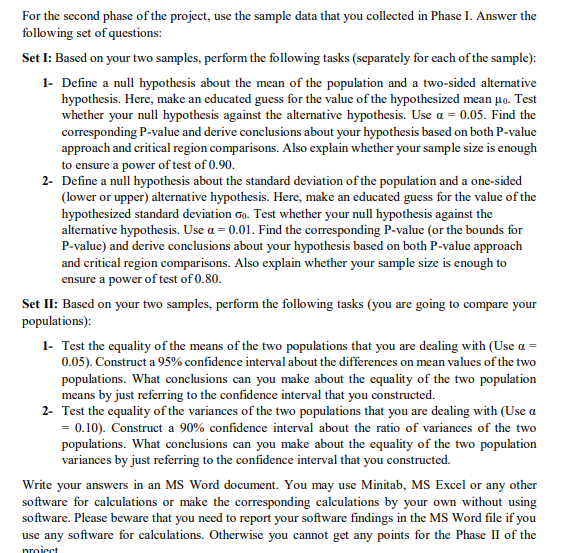
For the second phase of the project, use the sample data that you collected in Phase I. Answer the following set of questions: Set I: Based on your two samples, perform the following tasks (separately for each of the sample): 1- Define a null hypothesis about the mean of the population and a two-sided alternative hypothesis. Here, make an educated guess for the value of the hypothesized mean po. Test whether your null hypothesis against the alternative hypothesis. Use a = 0.05. Find the corresponding P-value and derive conclusions about your hypothesis based on both P-value approach and critical region comparisons. Also explain whether your sample size is enough to ensure a power of test of 0.90. 2- Define a null hypothesis about the standard deviation of the population and a one-sided (lower or upper) alternative hypothesis. Here, make an educated guess for the value of the hypothesized standard deviation Go. Test whether your null hypothesis against the alternative hypothesis. Use a = 0.01. Find the corresponding P-value (or the bounds for P-value) and derive conclusions about your hypothesis based on both P-value approach and critical region comparisons. Also explain whether your sample size is enough to ensure a power of test of 0.80. Set II: Based on your two samples, perform the following tasks (you are going to compare your populations): 1- Test the equality of the means of the two populations that you are dealing with (Use a = 0.05). Construct a 95% confidence interval about the differences on mean values of the two populations. What conclusions can you make about the equality of the two population means by just referring to the confidence interval that you constructed. 2- Test the equality of the variances of the two populations that you are dealing with (Use a = 0.10). Construct a 90% confidence interval about the ratio of variances of the two populations. What conclusions can you make about the equality of the two population variances by just referring to the confidence interval that you constructed. Write your answers in an MS Word document. You may use Minitab, MS Excel or any other software for calculations or make the corresponding calculations by your own without using software. Please beware that you need to report your software findings in the MS Word file if you use any software for calculations. Otherwise you cannot get any points for the Phase II of the


