

Question: hi i need to answer to this question based on the questions below Provide a brief summary of your findings form this analysis. What insights
hi i need to answer to this question based on the questions below
Provide a brief summary of your findings form this analysis. What insights did you gain from the summary statistics and visualizations? Are there any limitations to this analysis that you should be aware of?
Using StatCrunch calculate the following summary statistics for price:
Mean =3892.141
Median =2388
Standard deviation =3979.6475
Minimum value =338
Maximum value =18552
25th percentile =897
75th percentile =5301.5
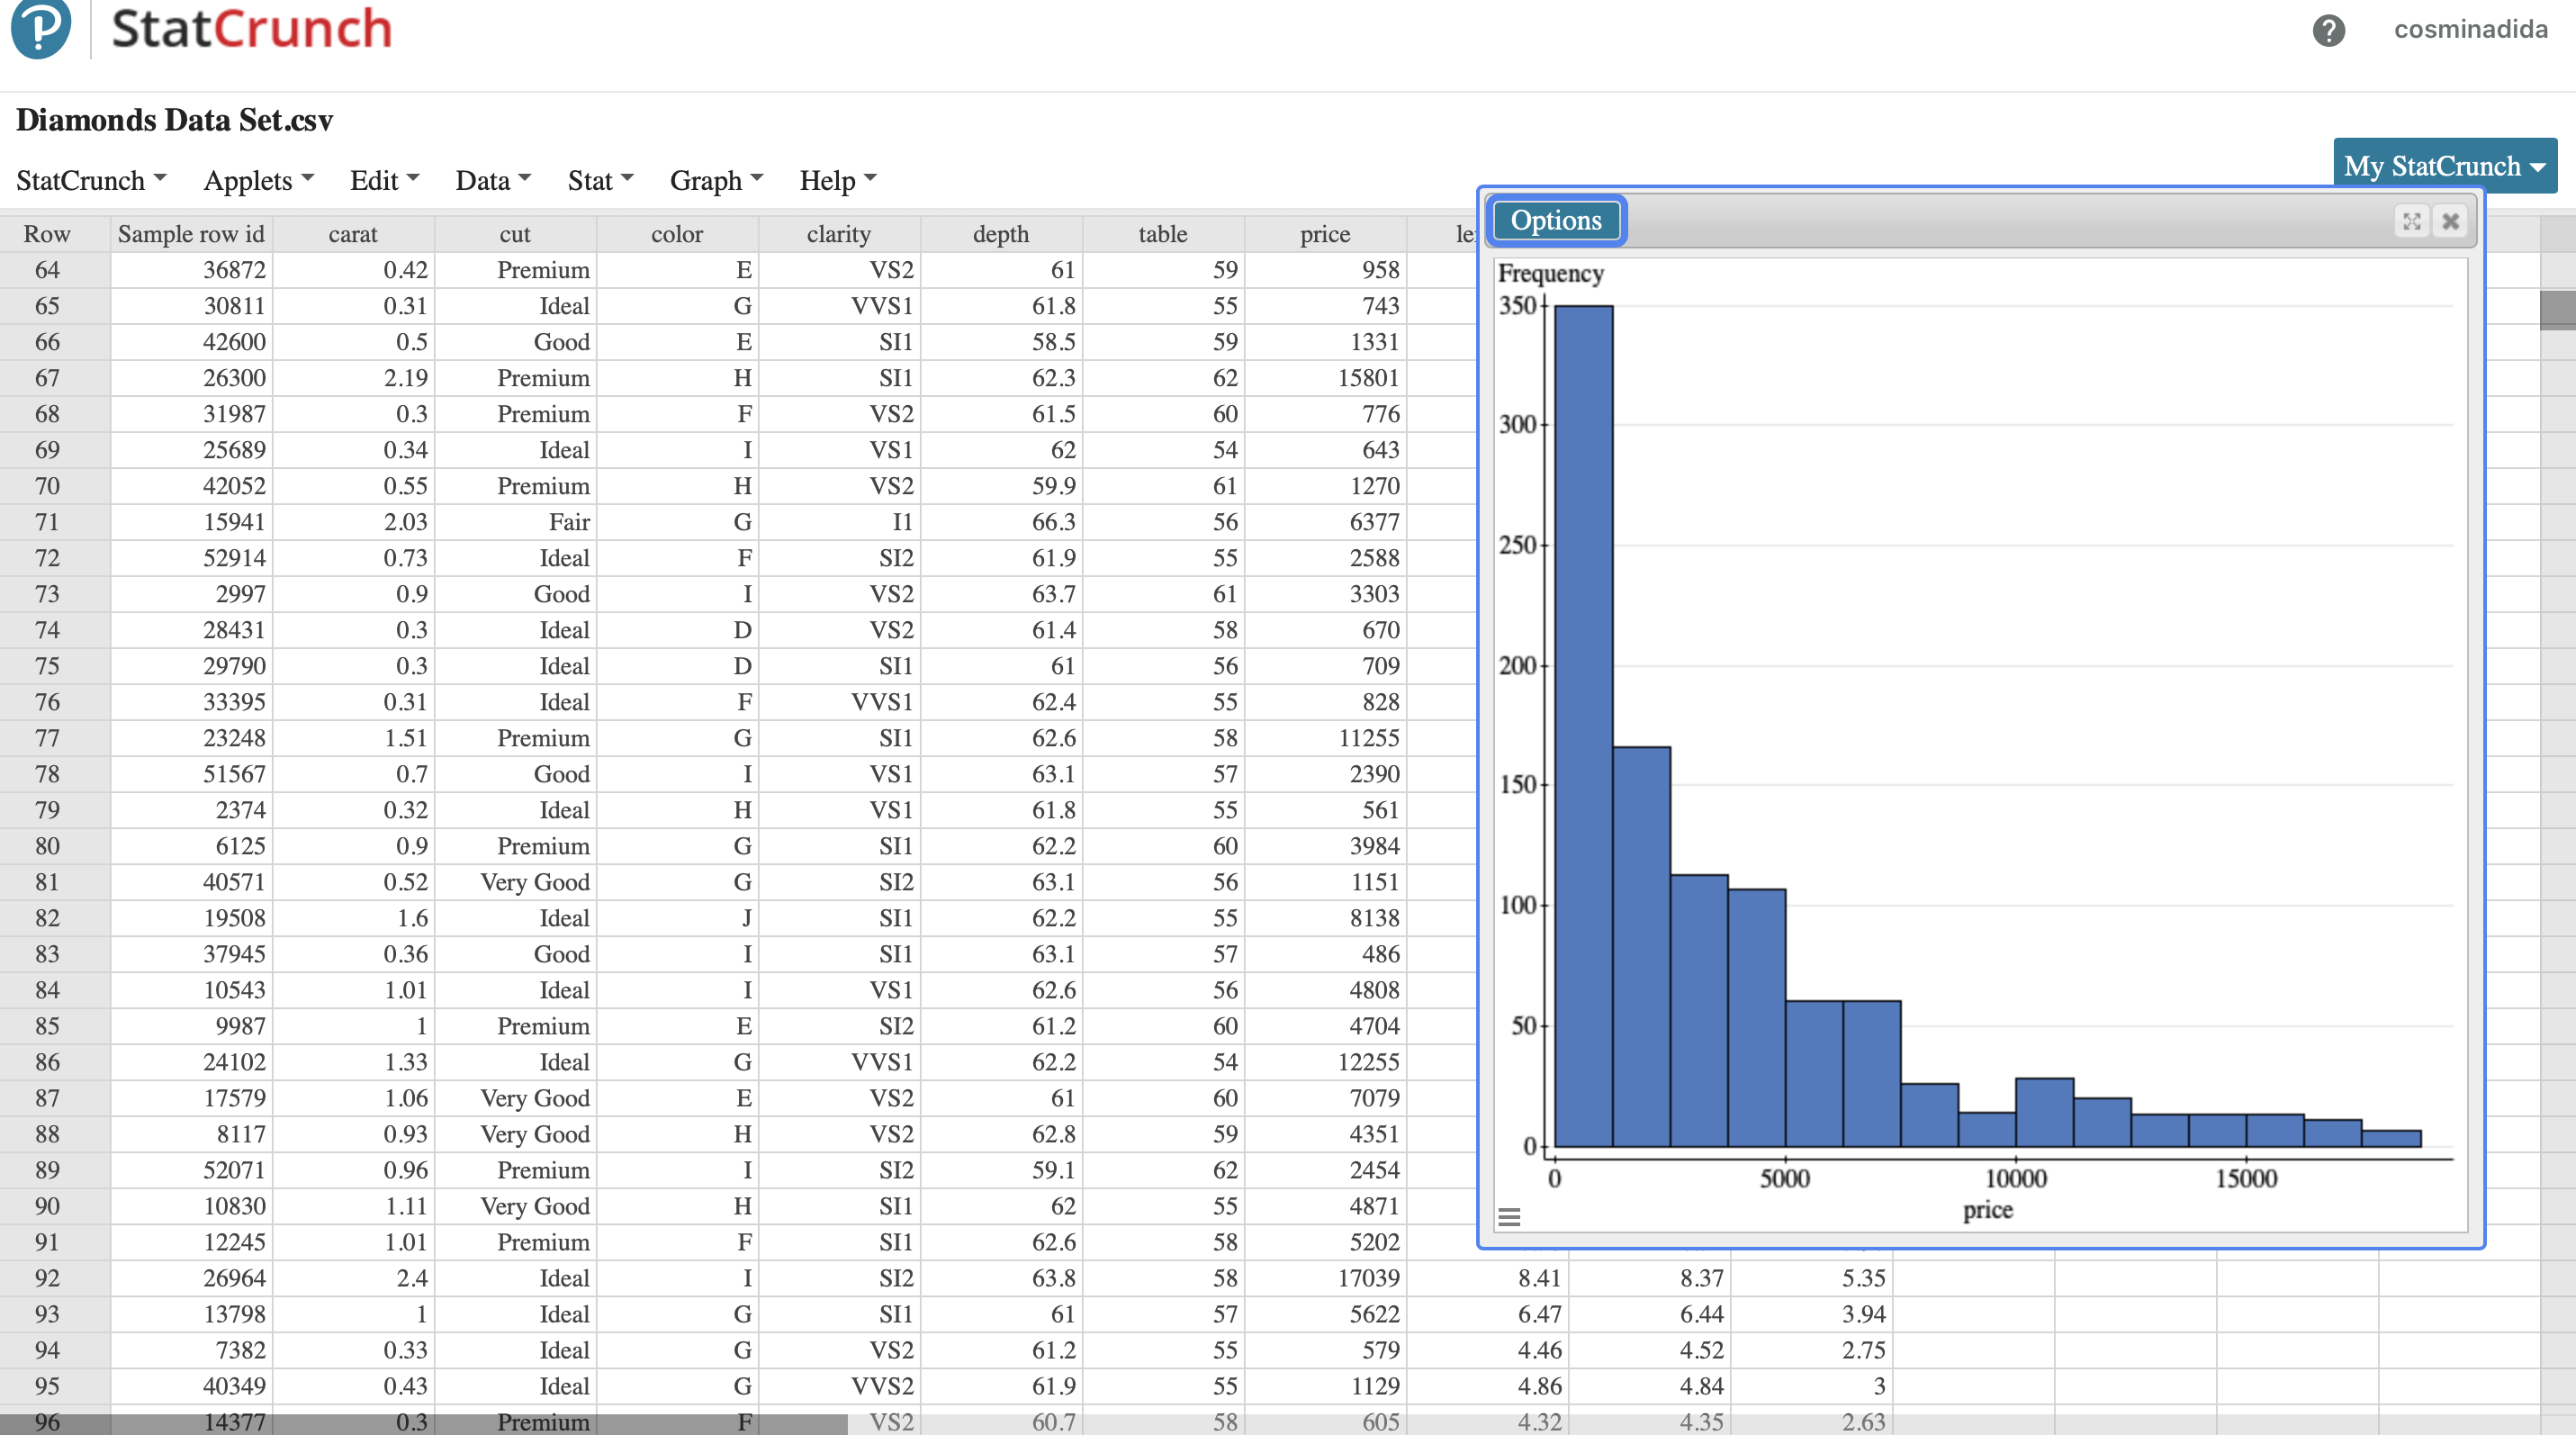
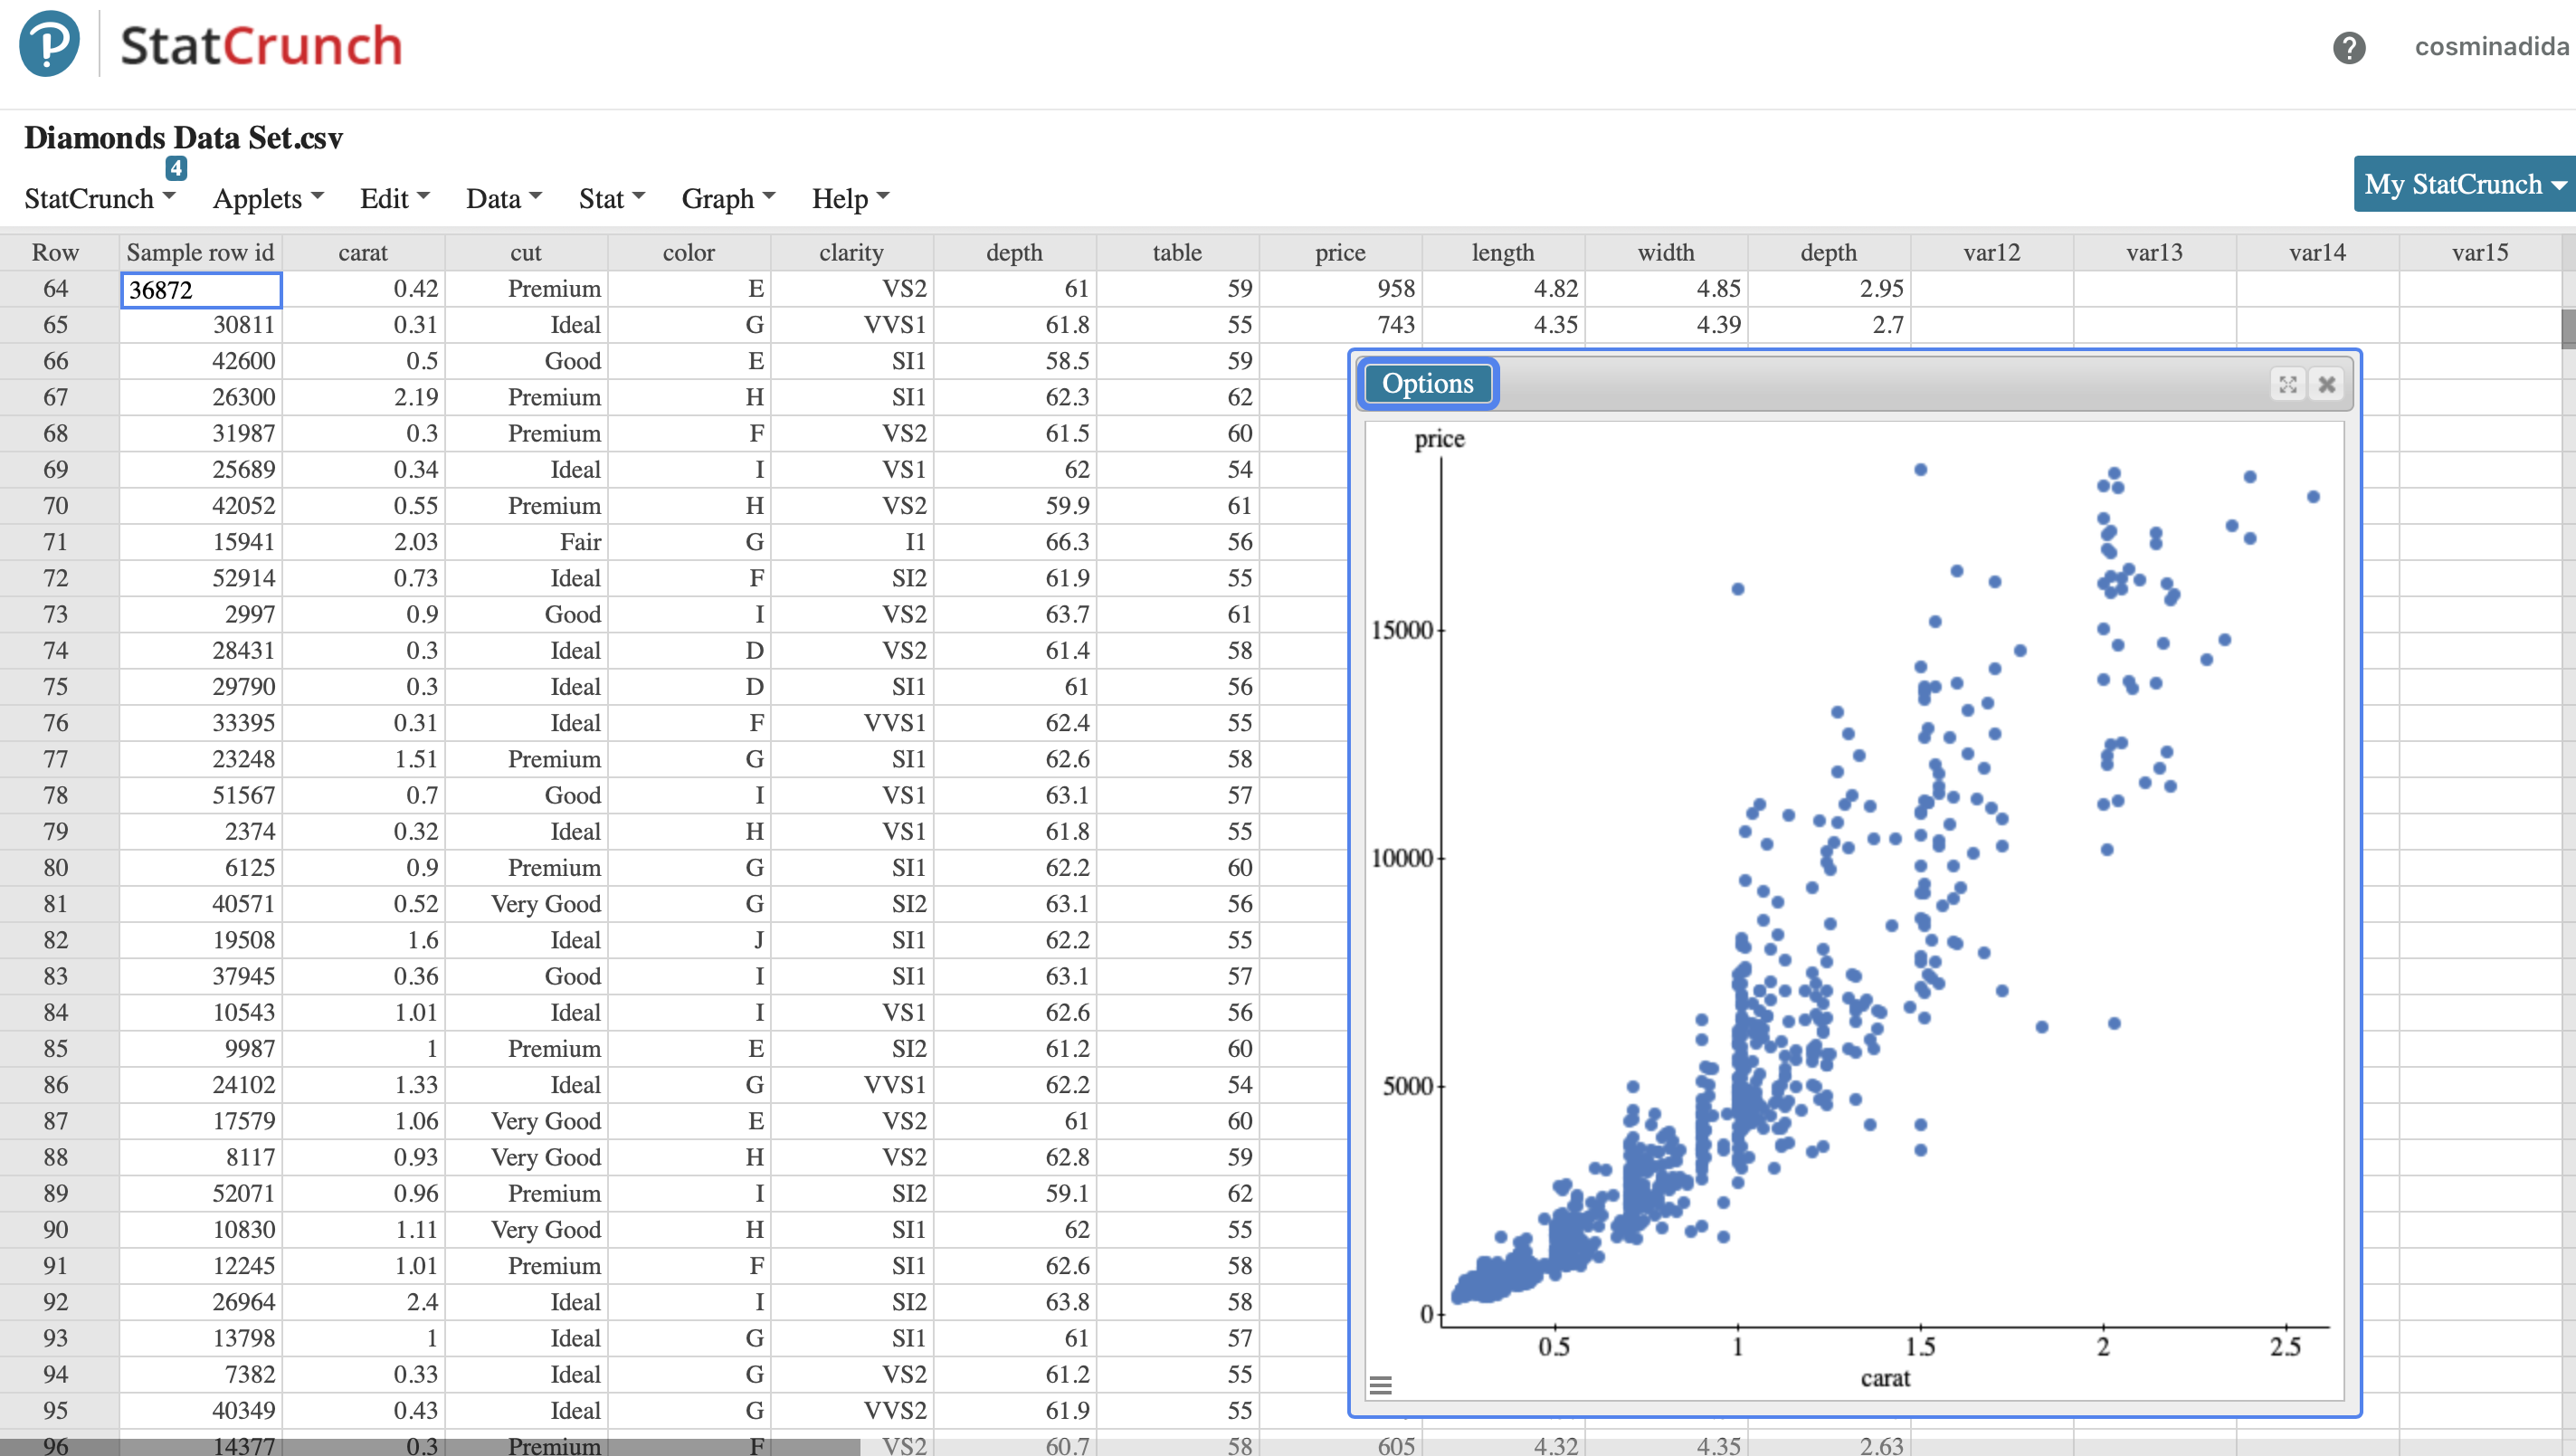
- Using StatCrunch, construct a histogram of price. Include the labels on the histogram and copy/paste that histogram into your answer. What does the shape of the histogram suggest about the distribution of prices?
P StatCrunch ? cosminadida Diamonds Data Set.csv StatCrunch Applets Edit Data Stat Graph Help My StatCrunch Row Sample row id carat cut color clarity depth table price le Options * X 64 36872 0.42 Premium E VS2 61 59 958 Frequency 65 30811 0.31 Ideal G VVS1 61.8 55 743 350 66 42600 0.5 Good E SI1 58.5 59 1331 67 26300 2.19 Premium H SI1 62.3 62 15801 68 31987 0.3 Premium VS2 61.5 60 776 69 25689 300- 0.34 Ideal VS 62 54 643 70 42052 0.55 Premium H VS2 59.9 61 1270 71 15941 2.03 Fair G I1 66.3 56 6377 72 52914 0.73 Ideal SI2 61.9 55 2588 250- 73 2997 0.9 Good I VS2 63.7 61 3303 74 28431 0.3 Ideal D VS2 61.4 58 670 75 29790 0.3 Ideal D SI1 61 56 709 200 76 33395 0.31 deal F VVS1 62.4 55 828 77 23248 1.51 Premium G SI1 62.6 58 11255 78 51567 0.7 Good I VS1 63.1 57 2390 79 2374 150 0.32 Ideal H VS1 61.8 55 561 80 6125 0.9 Premium G SI1 62.2 60 3984 81 40571 0.52 Very Good G SI2 63.1 56 1151 82 19508 1.6 Ideal SI1 62.2 55 8138 100 83 37945 0.36 Good SI1 63.1 57 486 84 10543 1.01 Ideal I VS1 62.6 56 4808 85 9987 Premium E SI2 61.2 60 4704 50- 86 24102 1.33 Ideal G VVS1 52.2 54 12255 87 17579 1.06 Very Good E VS2 61 60 7079 88 8117 ).93 Very Good H VS2 62.8 59 4351 89 52071 ).96 Premium I SI2 59.1 62 2454 90 10830 1.11 Very Good 5000 10000 H SI1 15000 62 55 4871 91 12245 price 1.01 Premium SI1 62.6 58 5202 92 26964 2.4 Idea I SI2 63.8 58 17039 8.41 8.37 5.35 93 13798 deal SI1 61 57 5622 6.47 6.44 3.94 94 7382 0.33 Ideal VS2 61.2 55 579 4.46 4.52 2.75 95 40349 0.43 Ideal VVS2 51.9 55 1129 4.86 4.84 3 96 14377 0.3 Premium VS2 60.7 58 505 1.32 4.35 2.63P StatCrunch ? cosminadida Diamonds Data Set.csv 1 StatCrunch Applets Edit Data Stat Graph Help My StatCrunch Row Sample row id carat cut color clarity depth table price length width depth var12 ur 15 64 36872 0.42 Premium E VS2 61 59 958 4.82 4.85 2.95 Options * X 65 30811 0.31 Ideal G VVS1 61.8 55 743 4.35 4.39 2.7 66 42600 0.5 Good E SI1 58.5 59 1331 5.2 .23 3.05 Summary statistics for price: Group by: cut 67 26300 2.19 Premium H SI1 52.3 62 15801 8.27 8.25 5.15 68 31987 0.3 Premium VS2 61.5 60 776 4.29 cut + 4.26 2.63 Mean 69 25689 0.34 Ideal I VS1 62 54 643 4.51 4.49 2.79 Fair 4495.2857 70 42052 0.55 Premium H VS2 59.9 61 1270 5.31 5.28 3.17 Good 4230.5979 71 15941 2.03 Fair G 56.3 56 5377 7.81 7.75 5.16 Ideal 3449.8701 72 52914 0.73 Ideal SI2 61.9 55 2588 5.78 5.82 3.59 73 2997 0.9 Good VS2 63.7 61 3303 6.06 6.1 3.87 Premium 4351.9496 74 28431 0.3 Ideal VS2 51.4 58 670 4.20 4.31 2.64 Very Good 4059.6901 75 29790 0.3 Ideal SI1 61 56 709 4.33 4.3 2.63 76 33395 0.31 Ideal VVS1 62.4 55 828 4.33 4.36 2.71 77 23248 1.51 Premium SI1 62.6 58 11255 7.3 7.27 4.56 78 51567 0.7 Good VS1 63.1 57 2390 5.59 5.67 3.55 79 2374 0.32 Ideal H VS1 1.8 55 561 4.41 4.42 2.73 80 6125 0.9 Premium G SI1 62.2 60 3984 6.14 6.07 3.8 81 40571 0.52 Very Good SI2 63.1 56 1151 5.12 5.08 3.22 4 2 82 19508 1.6 Ideal SI1 62.2 55 8138 7.46 7.53 4.66 83 37945 0.36 Good SI1 53.1 57 486 4.51 4.55 2.86 84 10543 1.01 [deal VS1 52.6 56 4808 6.42 .36 85 9987 Premium E SI2 61.2 60 4704 6.45 6.42 3.94 86 24102 1.33 Ideal VVS1 62.2 54 12255 7.02 7.06 4.38 87 17579 1.06 Very Good VS2 61 60 7079 6.57 6.53 88 8117 0.93 Very Good H VS2 62.8 59 4351 6.13 6.16 3.86 89 52071 0.96 Premium SI2 59.1 62 2454 6.48 6.38 3.79 90 10830 1.11 Very Good H SI1 62 55 4871 6.61 6.68 4.12 91 12245 1.01 Premium SI1 62.6 58 5202 6.37 6.32 3.97 92 26964 2.4 Ideal SI2 53.8 58 17039 8.41 8.37 5.35 93 13798 Ideal SI1 61 57 5622 6.47 6.44 3.94 94 7382 0.33 Ideal VS2 61.2 55 579 4.46 4.52 2.75 95 40349 0.43 Ideal VVS2 51.9 55 1129 4.86 4.84 3Diamonds Data Set.csv 2 StatCrunch Applets Edit Data Stat Graph Help My StatCrunch Row Sample row id carat cut color clarity depth table price length width depth var12 var13 var14 var15 64 36872 0.42 Premium E VS2 61 59 958 65 30811 0.31 Idea G VVS1 61.8 55 743 Options 66 42600 0.5 Good E SI1 58.5 59 1331 price 67 26300 2.19 Premium H SI1 62.3 62 15801 68 31987 0.3 Premium F VS2 61.5 60 776 . 69 25689 0.34 Ideal VS1 62 54 643 . ... co 70 42052 0.55 Premium H VS2 59.9 61 1270 . . . . .. 71 15941 2.03 Fair G I1 66.3 56 6377 15000 . . . 72 52914 0.73 Ideal F SI2 61.9 55 2588 ... . . . . 09 73 2997 0.9 Good I VS2 63.7 61 3303 74 28431 0.3 Ideal D VS2 61.4 58 670 75 29790 0.3 Ideal D SI1 61 56 709 76 33395 0.31 Ideal VVS1 62.4 55 828 . . 77 23248 1.51 Premium G SI1 62.6 58 11255 78 51567 0.7 Good I VS1 63.1 57 2390 10000 79 2374 0.32 Ideal H VS1 61.8 55 561 80 6125 0.9 Premium G SI1 62.2 60 3984 81 40571 0.52 Very Good G SI2 63.1 56 1151 82 19508 1.6 Idea SI1 62.2 55 8138 83 37945 0.36 Good SI1 63.1 57 486 84 10543 1.01 Ideal VS1 62.6 56 4808 5000 85 9987 Premium SI2 61.2 60 4704 86 24102 1.33 Ideal G VVS1 62.2 54 12255 87 17579 1.06 Very Good E VS2 61 60 7079 88 8117 0.93 Very Good H VS2 62.8 59 4351 89 52071 0.96 Premium I SI2 59.1 62 2454 90 10830 1.11 Very Good H SI1 62 55 4871 91 12245 1.01 Premium F SI1 62.6 58 5202 Fair Good Ideal Premium Very Good 92 26964 2.4 Ideal I SI2 63.8 58 17039 E cut 93 13798 Ideal G SI1 61 57 5622 94 7382 0.33 Ideal VS2 61.2 55 579 4.46 4.52 2.75 95 40349 0.43 Ideal VVS2 61.9 55 1129 4.86 4.84P StatCrunch ? cosminadida Diamonds Data Set.csv 3 StatCrunch Applets Edit Data Stat Graph Help My StatCrunch Row Sample row id cara cut color clarity depth table price length width depth var12 var13 var14 var15 64 36872 0.42 Premium E VS2 61 59 958 4.82 4.85 2.95 65 30811 0.31 Ideal G VVS1 61.8 55 743 4.35 4.39 66 42600 0.5 Good E SI1 58.5 59 1331 5.2 5.23 Options 67 26300 2.19 Premium H SI1 62.3 62 15801 8.27 8.25 68 31987 0.3 Premium VS2 61.5 60 776 4.29 4.26 Correlation between price and carat is: 69 25689 0.34 Ideal I VS1 62 54 643 4.51 4.49 0.93050662 70 42052 0.55 Premium H VS 59.9 61 1270 5.31 No correlogram when there are only 2 columns 5.28 71 15941 2.03 Fair G I1 66.3 56 6377 7.81 7.75 72 52914 0.73 Ideal F SI2 61.9 55 2588 5.78 5.82 73 2997 0.9 Good VS2 63.7 61 3303 6.06 6.1 3.87 74 28431 0.3 Ideal D VS2 61.4 58 670 4.29 4.31 2.64 75 29790 0.3 Ideal D SI1 61 56 709 4.33 4.3 2.63 76 33395 0.31 [deal VVS1 62.4 55 828 4.33 4.36 2.71 77 23248 1.51 Premium G SI1 62.6 58 11255 7.3 7.27 4.56 78 51567 0.7 Good VS1 63.1 57 2390 5.59 5.67 3.55 79 2374 .32 Ideal H VS1 61.8 55 561 4.41 4.42 2.73 80 5125 0.9 Premium G SI1 62.2 60 3984 6.14 6.07 3.8 81 40571 0.52 Very Good G SI2 63.1 56 1151 5.12 5.08 3.22 82 19508 1.6 Ideal SI1 62.2 55 8138 7.46 7.53 4.66 83 37945 0.36 Good SI1 63.1 57 486 4.51 4.55 2.86 84 10543 1.01 deal VS1 62.6 56 4808 6.42 6.36 85 9987 Premium SI2 61.2 60 4704 6.45 6.42 3.94 86 24102 1.33 Ideal G VVS1 62.2 54 12255 7.02 7.06 4.38 87 17579 1.06 Very Good E VS2 61 60 7079 6.57 6.53 88 8117 0.93 Very Good H VS 62.8 59 4351 6.13 6.16 3.86 89 52071 0.96 Premium I SI2 59.1 62 2454 6.48 6.38 3.79 90 10830 1.11 Very Good H SI1 62 55 4871 6.61 6.68 4.12 91 12245 1.01 Premium SI1 62.6 58 5202 6.37 6.32 3.97 92 26964 2.4 Ideal SI2 63.8 58 17039 8.41 8.37 5.35 93 13798 Ideal G SI1 61 57 5622 6.47 6.44 3.94 94 7382 .33 Ideal VS2 61.2 55 579 4.46 4.52 2.75 95 40349 0.43 Ideal VVS2 61.9 55 1129 4.86 4.84 3 96 14377 0.3 Premium F VS2 60.7 58 605 4.32 4.35 2.63P StatCrunch ? cosminadida Diamonds Data Set.csv 4 StatCrunch Applets Edit Data Stat Graph Help My StatCrunch Row Sample row id carat cut color clarity depth table price length width depth var12 var13 var14 var15 64 36872 0.42 Premium E VS2 61 59 958 4.82 4.85 2.95 65 30811 0.31 Ideal G VVS1 61.8 55 743 4.35 4.39 2.7 66 42600 0.5 Good E SI1 58.5 59 67 26300 2.19 Premium H SI1 62.3 62 Options 68 31987 0.3 Premium VS2 61.5 60 price 69 25689 0.34 [deal VS1 62 54 70 42052 0.55 Premium H VS2 59.9 61 71 15941 2.03 Fair G I1 66.3 56 72 52914 ).73 Ideal F SI2 61.9 55 73 299 0.9 Good I VS 63.7 61 74 28431 0.3 Ideal D 15000 VS2 61.4 58 75 29790 0.3 Ideal D SI1 61 56 76 33395 0.31 Ideal F VVS1 62.4 55 77 23248 1.51 Premium G SI1 62.6 58 78 51567 0.7 Good I VS1 63.1 57 79 2374 0.32 Ideal H VS1 61.8 55 80 6125 0.9 Premium G SI1 62.2 60 10000- 81 40571 0.52 Very Good G SI2 63.1 56 82 19508 1.6 Ideal J 2.2 55 83 37945 0.36 Good SI1 63.1 57 84 10543 1.01 Ideal VS1 62.6 56 85 9987 Premium E SI2 61.2 60 86 24102 1.33 Ideal G VVS1 62.2 54 5000 87 17579 ..06 Very Good VS2 61 60 88 8117 0.93 Very Good H VS2 62.8 59 89 52071 0.9 Premium I SI2 59.1 62 90 10830 1.11 Very Good H SI1 62 55 91 12245 1.01 Premium F SI1 62.6 58 92 26964 2.4 Ideal SI2 63.8 58 93 13798 Ideal Q Q H SII 61 57 0.5 94 7382 1.5 0.33 2 Ideal VS2 2.5 61.2 55 = carat 95 40349 0.43 Ideal G VVS2 61.9 55 VS2 58 1.32 4.35
Step by Step Solution
There are 3 Steps involved in it

Get step-by-step solutions from verified subject matter experts