

Answered step by step
Verified Expert Solution
Question
1 Approved Answer
hi! I need to do a graph with this data, I really need help. this is for a lab report E. READING THE RESULTS The
hi! I need to do a graph with this data, I really need help. this is for a lab report 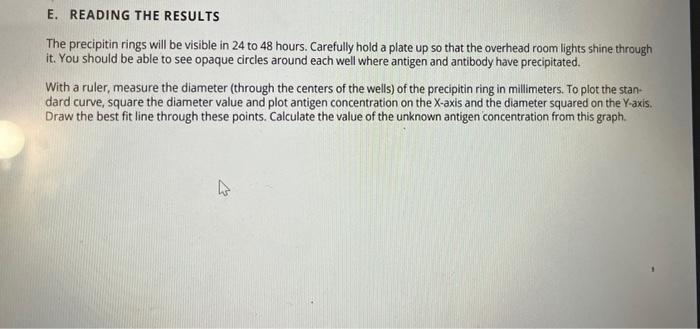
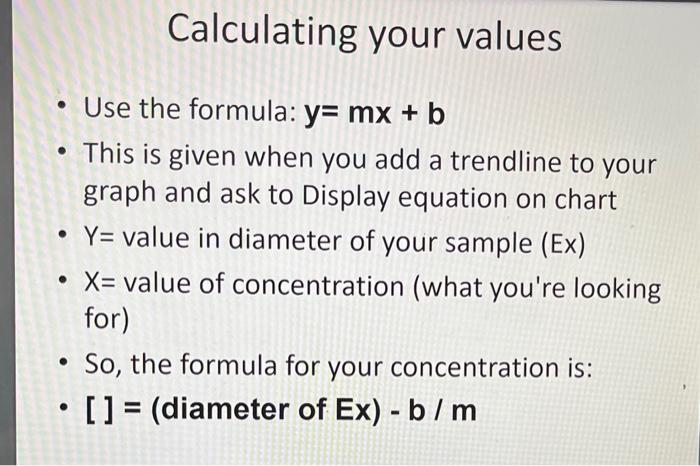
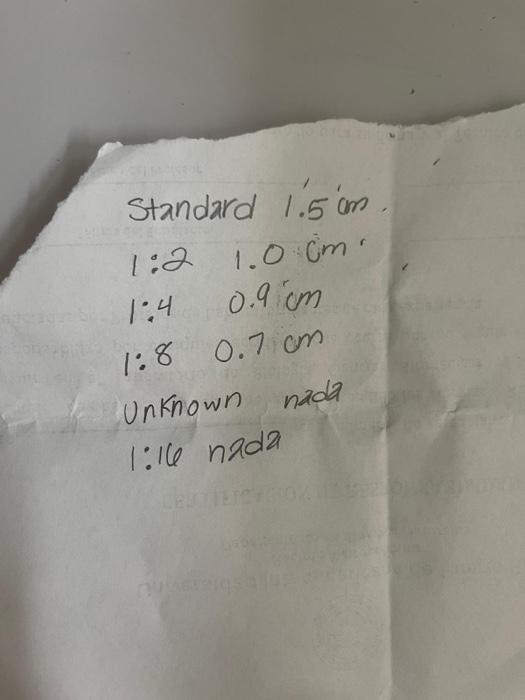
E. READING THE RESULTS The precipitin rings will be visible in 24 to 48 hours. Carefully hold a plate up so that the overhead room lights shine through it. You should be able to see opaque circles around each well where antigen and antibody have precipitated. With a ruler, measure the diameter (through the centers of the wells) of the precipitin ring in millimeters. To plot the standard curve, square the diameter value and plot antigen concentration on the X-axis and the diameter squared on the Y-axis. Draw the best fit line through these points. Calculate the value of the unknown antigen concentration from this graph. Calculating your values - Use the formula: y=mx+b - This is given when you add a trendline to your graph and ask to Display equation on chart - Y= value in diameter of your sample (Ex) - X= value of concentration (what you're looking for) - So, the formula for your concentration is: - [ ] = (diameter of Ex) - b/m Standard 1.5cm 1:21.0cm. 1:40.9cm 1:80.7cm Unknown nada 1:16 nada E. READING THE RESULTS The precipitin rings will be visible in 24 to 48 hours. Carefully hold a plate up so that the overhead room lights shine through it. You should be able to see opaque circles around each well where antigen and antibody have precipitated. With a ruler, measure the diameter (through the centers of the wells) of the precipitin ring in millimeters. To plot the standard curve, square the diameter value and plot antigen concentration on the X-axis and the diameter squared on the Y-axis. Draw the best fit line through these points. Calculate the value of the unknown antigen concentration from this graph. Calculating your values - Use the formula: y=mx+b - This is given when you add a trendline to your graph and ask to Display equation on chart - Y= value in diameter of your sample (Ex) - X= value of concentration (what you're looking for) - So, the formula for your concentration is: - [ ] = (diameter of Ex) - b/m Standard 1.5cm 1:21.0cm. 1:40.9cm 1:80.7cm Unknown nada 1:16 nada Step by Step Solution
There are 3 Steps involved in it
Step: 1

Get Instant Access to Expert-Tailored Solutions
See step-by-step solutions with expert insights and AI powered tools for academic success
Step: 2

Step: 3
Ace Your Homework with AI
Get the answers you need in no time with our AI-driven, step-by-step assistance
Get Started
Chemistry
Authors: Raymond Chang
10th edition
77274318, 978-0077274313