Hi
I was wondering if anyone can assist me in these problems. Thank you!
(My questions went backwards so it is from 20-1 if you can please label them it would be awesome thank you for your help)
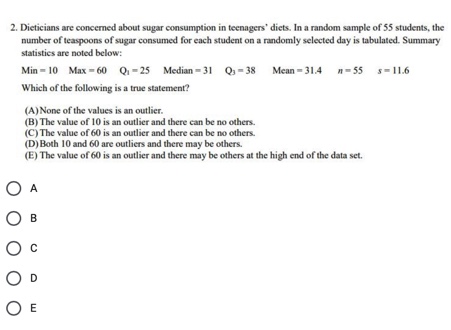
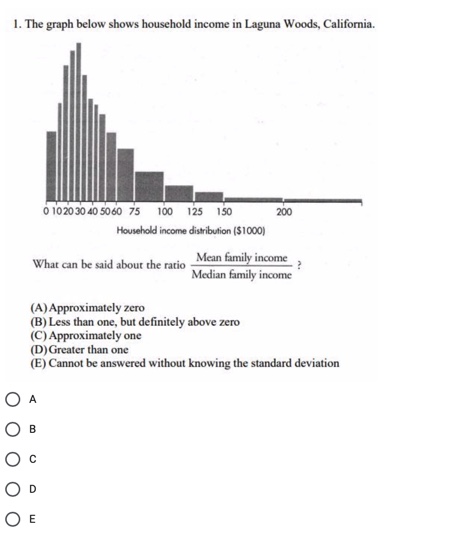
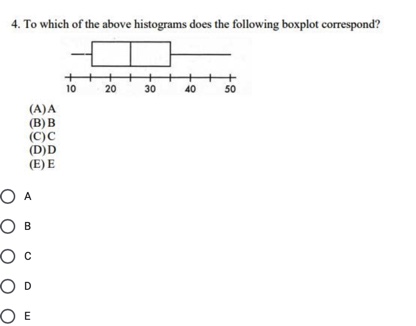
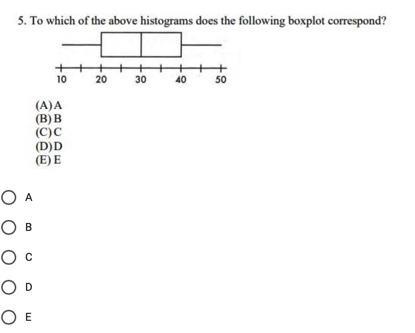
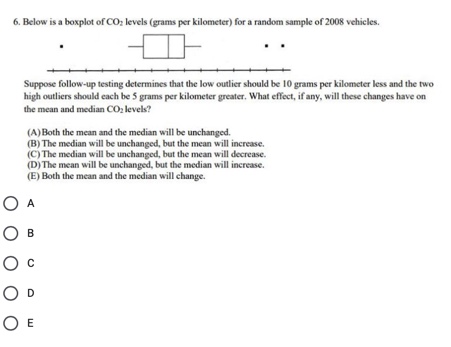
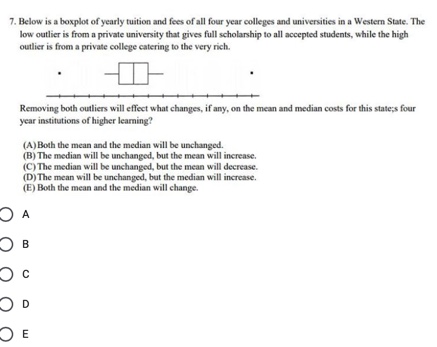
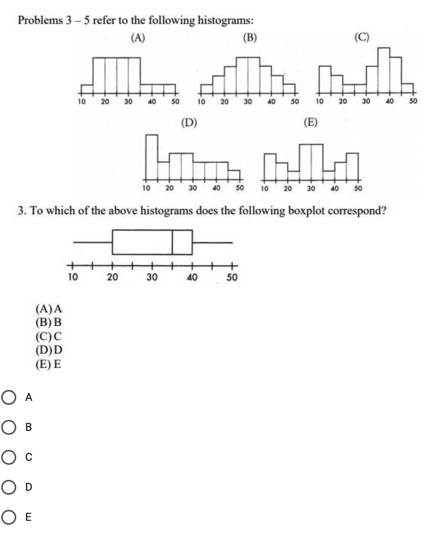
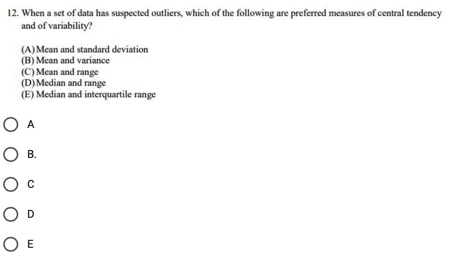
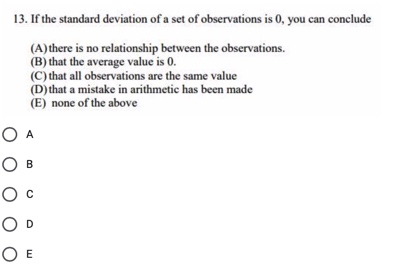
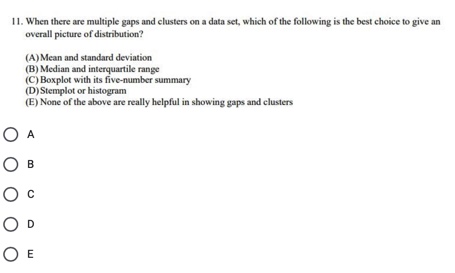
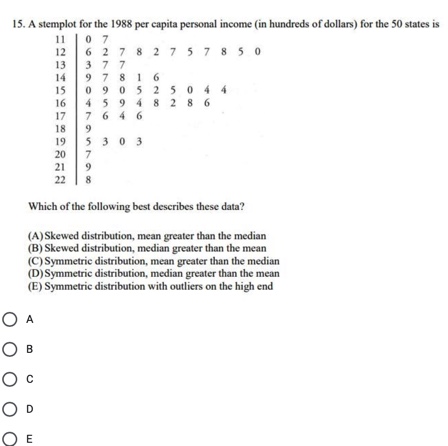
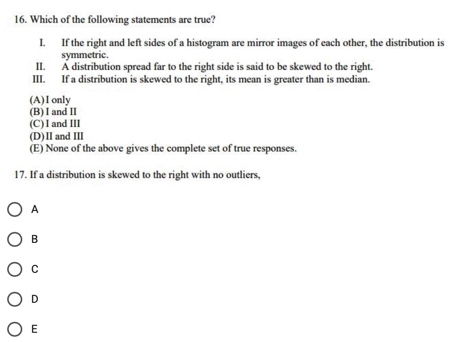
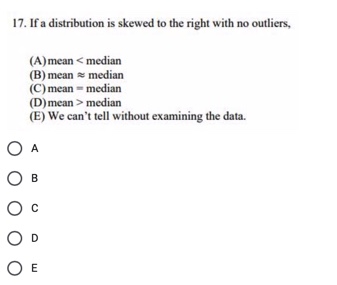
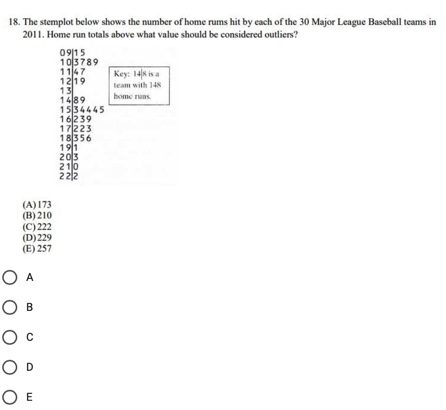
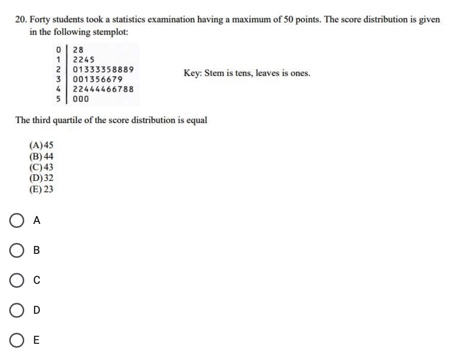
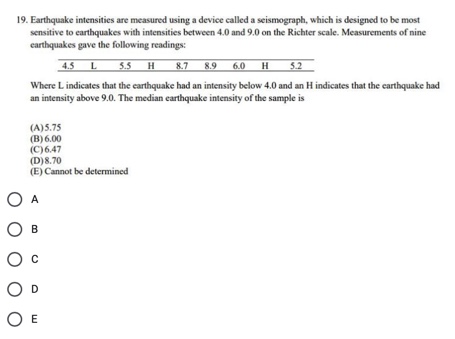
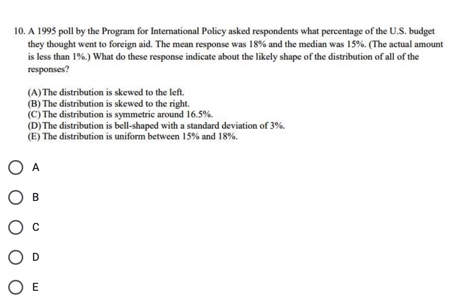
2. Dieticians are concerned about sugar consumption in teenagers' diets. In a random sample of 55 students, the number of teaspoons of sugar consumed for each student on a randomly selected day is tabulated. Summary statistics are noted below: Min - 10 Max -60 Q1 -25 Median -31 Q, -38 Mean - 314 0 55 5= 11.6 Which of the following is a true statement? (A) None of the values is an outlier. (B) The value of 10 is an outlier and there can be no others. (C) The value of 60 is an outlier and there can be no others. (D) Both 10 and 60 are outliers and there may be others. (E) The value of 60 is an outlier and there may be others at the high end of the data set. O A O B O c OD O E1. The graph below shows household income in Laguna Woods, California. 0 1020 30 40 5060 75 100 125 150 200 Household income distribution ($1000) What can be said about the ratio Mean family income Median family income (A) Approximately zero (B) Less than one, but definitely above zero (C) Approximately one (D) Greater than one (E) Cannot be answered without knowing the standard deviation O A OB O C OD OE4. To which of the above histograms does the following boxplot correspond? 10 20 30 40 50 (A)A (B)B (C)C (D)D (B) E O O B O C O O E5. To which of the above histograms does the following boxplot correspond? 10 20 30 40 50 (A)A (B)B (C)c (D)D (E) E O A O B O O6. Below is a boxplot of CO, levels (grams per kilometer) for a random sample of 2008 vehicles. Suppose follow-up testing determines that the low outlier should be 10 grams per kilometer less and the two high outliers should each be 5 grams per kilometer greater. What effect, if any, will these changes have on the mean and median CO, levels? (A) Both the mean and the median will be unchanged. (B) The median will be unchanged, but the mean will increase. (C) The median will be unchanged, but the mean will decrease. (D) The mean will be unchanged, but the median will increase. (E) Both the mean and the median will change. O A O B O c O D O7. Below is a boxplot of yearly tuition and fees of all four year colleges and universities in a Western State. The low outlier is from a private university that gives full scholarship to all accepted students, while the high outlier is from a private college catering to the very rich. Removing both outliers will effect what changes, if any, on the mean and median costs for this state's four year institutions of higher learning? (A) Both the mean and the median will be unchanged. (B) The median will be unchanged, but the mean will increase. (C) The median will be unchanged, but the mean will decrease. (D) The mean will be unchanged, but the median will increase. (E) Both the mean and the median will change. O B O c O OProblems 3 -5 refer to the following histograms: (A) (B) (0) 10 20 30 10 (D) (E) 10 20 30 3. To which of the above histograms does the following boxplot correspond? 10 20 30 10 50 (A)A (B)B (C)C (D)D (E) E O A O B O c O D OE12. When a set of data has suspected outliers, which of the following are preferred measures of central tendency and of variability? (A) Mean and standard deviation (B) Mean and variance (C) Mean and range (D) Median and range (E) Median and interquartile range O A O B. O C O OE13. If the standard deviation of a set of observations is 0, you can conclude (A) there is no relationship between the observations. (B) that the average value is 0. (C) that all observations are the same value (D) that a mistake in arithmetic has been made (E) none of the above O O B O O D OE1 1. When there are multiple gaps and clusters on a data set, which of the following is the best choice to give an overall picture of distribution? (A) Mean and standard deviation (B) Median and interquartile range (C) Boxplot with its five-number summary (D) Stemplot or histogram (E) None of the above are really helpful in showing gaps and clusters O A O B O C O D O15. A stemplot for the 1988 per capita personal income (in hundreds of dollars) for the 50 states is 11 0 7 12 7 8 2 7 5 7 8 50 13 7 14 7 8 1 15 9 0 5 0 4 4 16 9 2 8 19 3 0 3 20 21 22 Which of the following best describes these data? (A) Skewed distribution, mean greater than the median (B) Skewed distribution, median greater than the mean (C) Symmetric distribution, mean greater than the median (D) Symmetric distribution, median greater than the mean (E) Symmetric distribution with outliers on the high end O A O B O C OD OE16. Which of the following statements are true? 1. If the right and left sides of a histogram are mirror images of each other, the distribution is symmetric. III. II. A distribution spread far to the right side is said to be skewed to the right. If a distribution is skewed to the right, its mean is greater than is median. (A) I only (B) I and II (C) I and III (D) II and III (E) None of the above gives the complete set of true responses. 17. If a distribution is skewed to the right with no outliers, O A O B O O D O17. If a distribution is skewed to the right with no outliers, (A) mean median (E) We can't tell without examining the data. O A O B O c O O18. The stemplot below shows the number of home rums hit by each of the 30 Major League Baseball teams in 201 1. Home run totals above what value should be considered outliers? 0915 103789 1147 1219 Key: H48isa 13 team with 148 14 89 1534445 16239 17223 18356 191 203 210 22 2 (A)173 (8) 210 (C) 222 (D) 229 (E) 257 O A OB O c OD OE20. Forty students took a statistics examination having a maximum of 50 points. The score distribution is given in the following stemplot: 28 2245 01353358689 001356679 Key: Stem is tens, leaves is ones. 22444466788 000 The third quartile of the score distribution is equal (A)45 (B) 44 (9)43 (D) 32 (E) 23 O O O O O E19. Earthquake intensities are measured using a device called a seismograph, which is designed to be most sensitive to earthquakes with intensities between 4.0 and 9.0 on the Richter scale. Measurements of nine earthquakes gave the following readings: 4.5 L 5.5 H 8.7 8.9 60 H 5.2 Where L indicates that the earthquake had an intensity below 4.0 and an H indicates that the earthquake had an intensity above 9.0. The median earthquake intensity of the sample is (A)5.75 (B) 6.00 (C)6.47 (D) 8.70 (E) Cannot be determined O A O B O c O O m10. A 1995 poll by the Program for International Policy asked respondents what percentage of the U.S. budget they thought went to foreign aid. The mean response was 18% and the median was 15%. (The actual amount is less than 1%.) What do these response indicate about the likely shape of the distribution of all of the responses? (A) The distribution is skewed to the left. (B) The distribution is skewed to the right. (C) The distribution is symmetric around 16.5%. (D) The distribution is bell-shaped with a standard deviation of 3%. (E) The distribution is uniform between 15% and 18%. OA O O c O O
