Hi, i'm doing these two questions, and i'm not sure what i did was right.
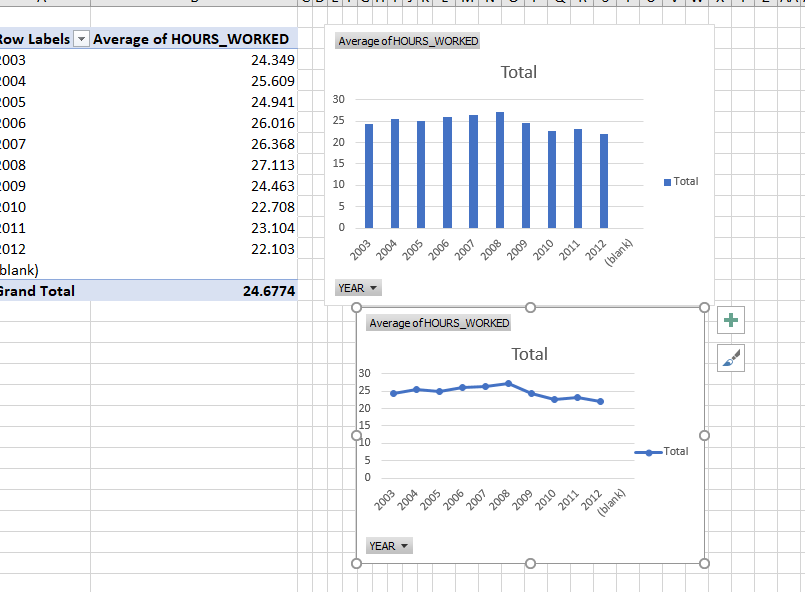
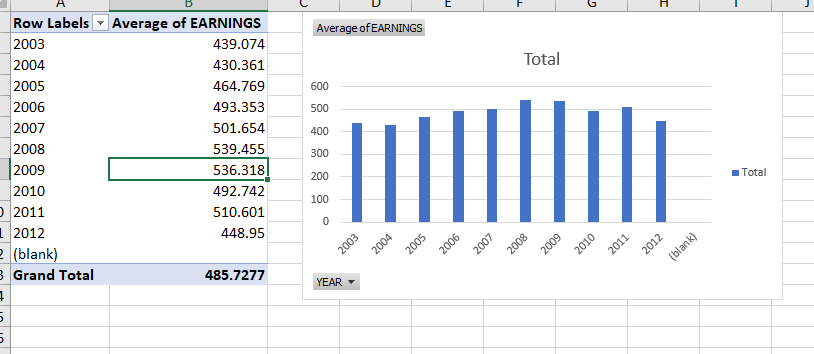
With the first question(average hours worked. Picture 3), i did line graph, you could see the results are pretty same. so, i was wondering what should be done for explain why this may make sense? and the second question,(Picture 2) i think it's required to do the line regression (y = salary x = hours worked)to analysis(R square, P-value...) the relationship between average weekly earnings and average number of hours worked per week. about the association should through correlation.
1. Provide an appropriate graphical display to visualise average number of hours of work per week over time (i.e., for the years 2003-2012). Comment on the trend you observe in your graphical display, and provide an explanation for why this may make sense. (Note that you will need to calculate averages for each year.) 2. Now provide a graphical display that additionally shows the average weekly earnings over time (i.e., for the years 2003-2012). What appears to be the relationship between average weekly earnings and average number of hours worked per week? Also provide an appropriate statistical measure of the association between weekly earnings and number of hours worked per week (for the original data, not the yearly averages), and comment on what this suggests about the relationship between weekly earnings and weekly number of hours worked.low Labels * Average of HOURS_WORKED Average of HOURS_WORKED 003 24.349 004 25.609 Total 005 24.941 30 1006 26.016 25 007 26.368 20 008 27.113 15 009 24.463 10 Total 010 22.708 5 1011 23.104 012 22.103 2003 2004 2005 2007 2008 2009 2010 2011 2012 blank blank) Grand Total 24.6774 YEAR - Average of HOURS_WORKED Total 30 25 20 15 1o Total 2003 2004 2005 2006 012 20 200 2009 2010 2011 (blank) YEARC Row Labels * Average of EARNINGS Average of EARNINGS 2003 439.074 2004 430.361 Total 2005 464.769 600 2006 493.353 500 2007 501.654 400 2008 539.455 300 2009 536.318 200 Total 2010 492.742 100 2011 510.601 0 2012 448.95 03 20 2004 (blank) 2005 06 20 200 200 2009 2010 2011 2012 (blank) Grand Total 485.7277 YEARATUS (Reduced) (5) - Excel (Product Activation Failed) O X File Home Insert Page Layout Formulas Data Review View Acrobat Tell me what you want to do.. & Share A1 X V EDUC A B C D E F G H I J K L M N O P EDUC AGE AGE_RANGE EMPLOYMEN SEX CHILDREN EARNINGS YEAR HOURS_WOFSLEEPING GROOMING HOUSEWORK FOOD_PREP CARETAKING PLAYING JOB_SEAR 37 2 2 0 2003 30 630 0 175 20 180 46 885 2003 50 410 30 0 C BV ONN 0 2003 0 450 60 0 75 145 YOU A W N 59 440 2003 40 400 55 15 75 0 39 0 2003 0 488 105 5 0 O O 0 2003 0 480 55 0 4 290 2003 38 750 36 0 0 2003 o 450 30 Gotoooo 2885 2003 60 540 45 o o O 0 2003 0 450 0 0 2003 0 360 60 538 0 2003 0 30 95 OHPOPO N W W O W O G N A D B W U K U N NOUNAWW 1385 2003 40 705 45 45 p o o o o o o o o o o o o o o o o o o o o o 0 0 0 NONONNONNNNNOPONKNOPNAN o O 420 2003 40 448 60 280 2003 20 405 115 15 303 2003 62 475 65 0 750 2003 40 360 30 0 H oo oo oo OO OO 0 2003 0 465 60 30 60 231 2003 35 520 105 0 NOOPOO 0 2003 40 563 35 10 0 0 2003 0 325 195 30 80 40 1000 2003 40 478 27 0 17 43 0 2003 0 540 71 3 62 21 25 30 750 43 525 120 330 O O p O 2003 Data Codebook +AGE RANGE Age range (0 = "0-19", 1 = "20-29", 2 = "30-39", 3 = "40-49", 4 = "50-59", 5 = "60- 69", 6 = "70-79", 7 = "80+"). EMPLOYMENT Employment status (0 = "Not in labour force", 1 = "Unemployed", 2 = "Employed"). SEX Sex of the respondent (0 = "Female", 1 = "Male"). CHILDREN Number of children. EARNINGS Weekly earnings (in USD). YEAR Year of the survey. HOURS WORKED Number of hours worked each week. SLEEPING Number of minutes spent sleeping the previous day. GROOMING Number of minutes spent grooming the previous day. HOUSEWORK Number of minutes spent doing housework the previous day. FOOD PREP Number of minutes spent on food and drink preparation the previous day. CARETAKING Number of minutes spent taking care of children the previous day. PLAYING Number of minutes spent playing with children the previous day. JOB SEARCHING Number of minutes spent searching for a job the previous day. SHOPPING Number of minutes spent shopping the previous day. EATING Number of minutes spent eating and drinking the previous day. SOCIALISING Number of minutes spent socialising and relaxing the previous day. TV Number of minutes spent watching television the previous day. GOLFING Number of minutes spent golfing the previous day. RUNNING Number of minutes spent running the previous day. VOLUNTEERING Number of minutes spent volunteering the previous day