Answered step by step
Verified Expert Solution
Question
1 Approved Answer
Hi, I'm having trouble understanding this question from my Signals and Systems II class. The question is from a lesson regarding Sampling and Reconstruction. Here
Hi, I'm having trouble understanding this question from my Signals and Systems II class. The question is from a lesson regarding Sampling and Reconstruction. Here is the question:
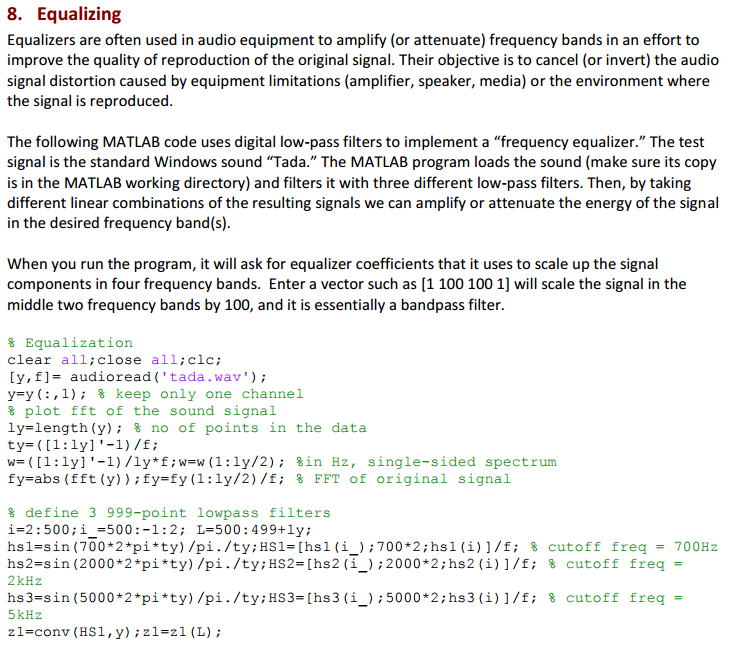
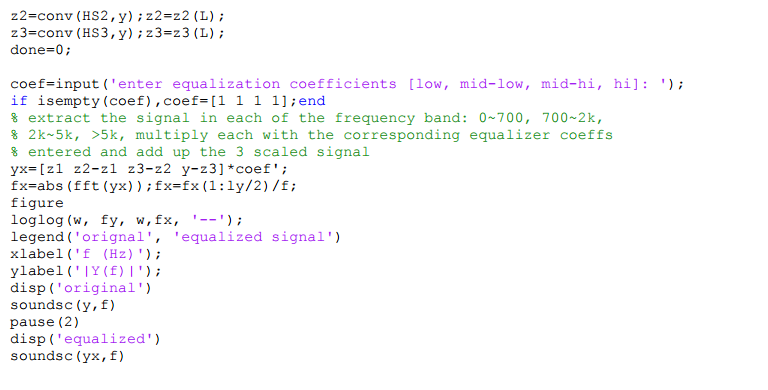
Here is section 8 from the lab:
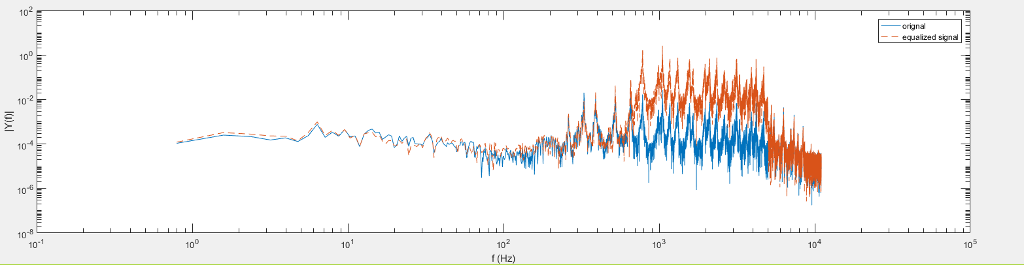
I understand you don't have access to the tada.wmv file. I ran the code using the sugested coordinates of [1 100 100 1] mentioned in the lab. This is the plot I got back:
Please explain this problem to me and provide suggested coordinates to use. How do I explain my answer using the resulting plots?
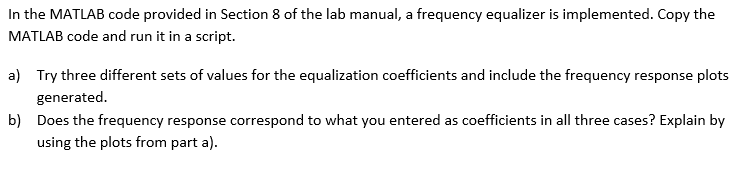
In the MATLAB code provided in Section 8 of the lab manual, a frequency equalizer is implemented. Copy the MATLAB code and run it in a script. a) Try three different sets of values for the equalization coefficients and include the frequency response plots generated. b) Does the frequency response correspond to what you entered as coefficients in all three cases? Explain by using the plots from part a)Step by Step Solution
There are 3 Steps involved in it
Step: 1

Get Instant Access to Expert-Tailored Solutions
See step-by-step solutions with expert insights and AI powered tools for academic success
Step: 2

Step: 3
Ace Your Homework with AI
Get the answers you need in no time with our AI-driven, step-by-step assistance
Get Started