

Question
Hi I've tried to solve some of the problems, but I'm having a hard time doing some of them. I was wondering if I could
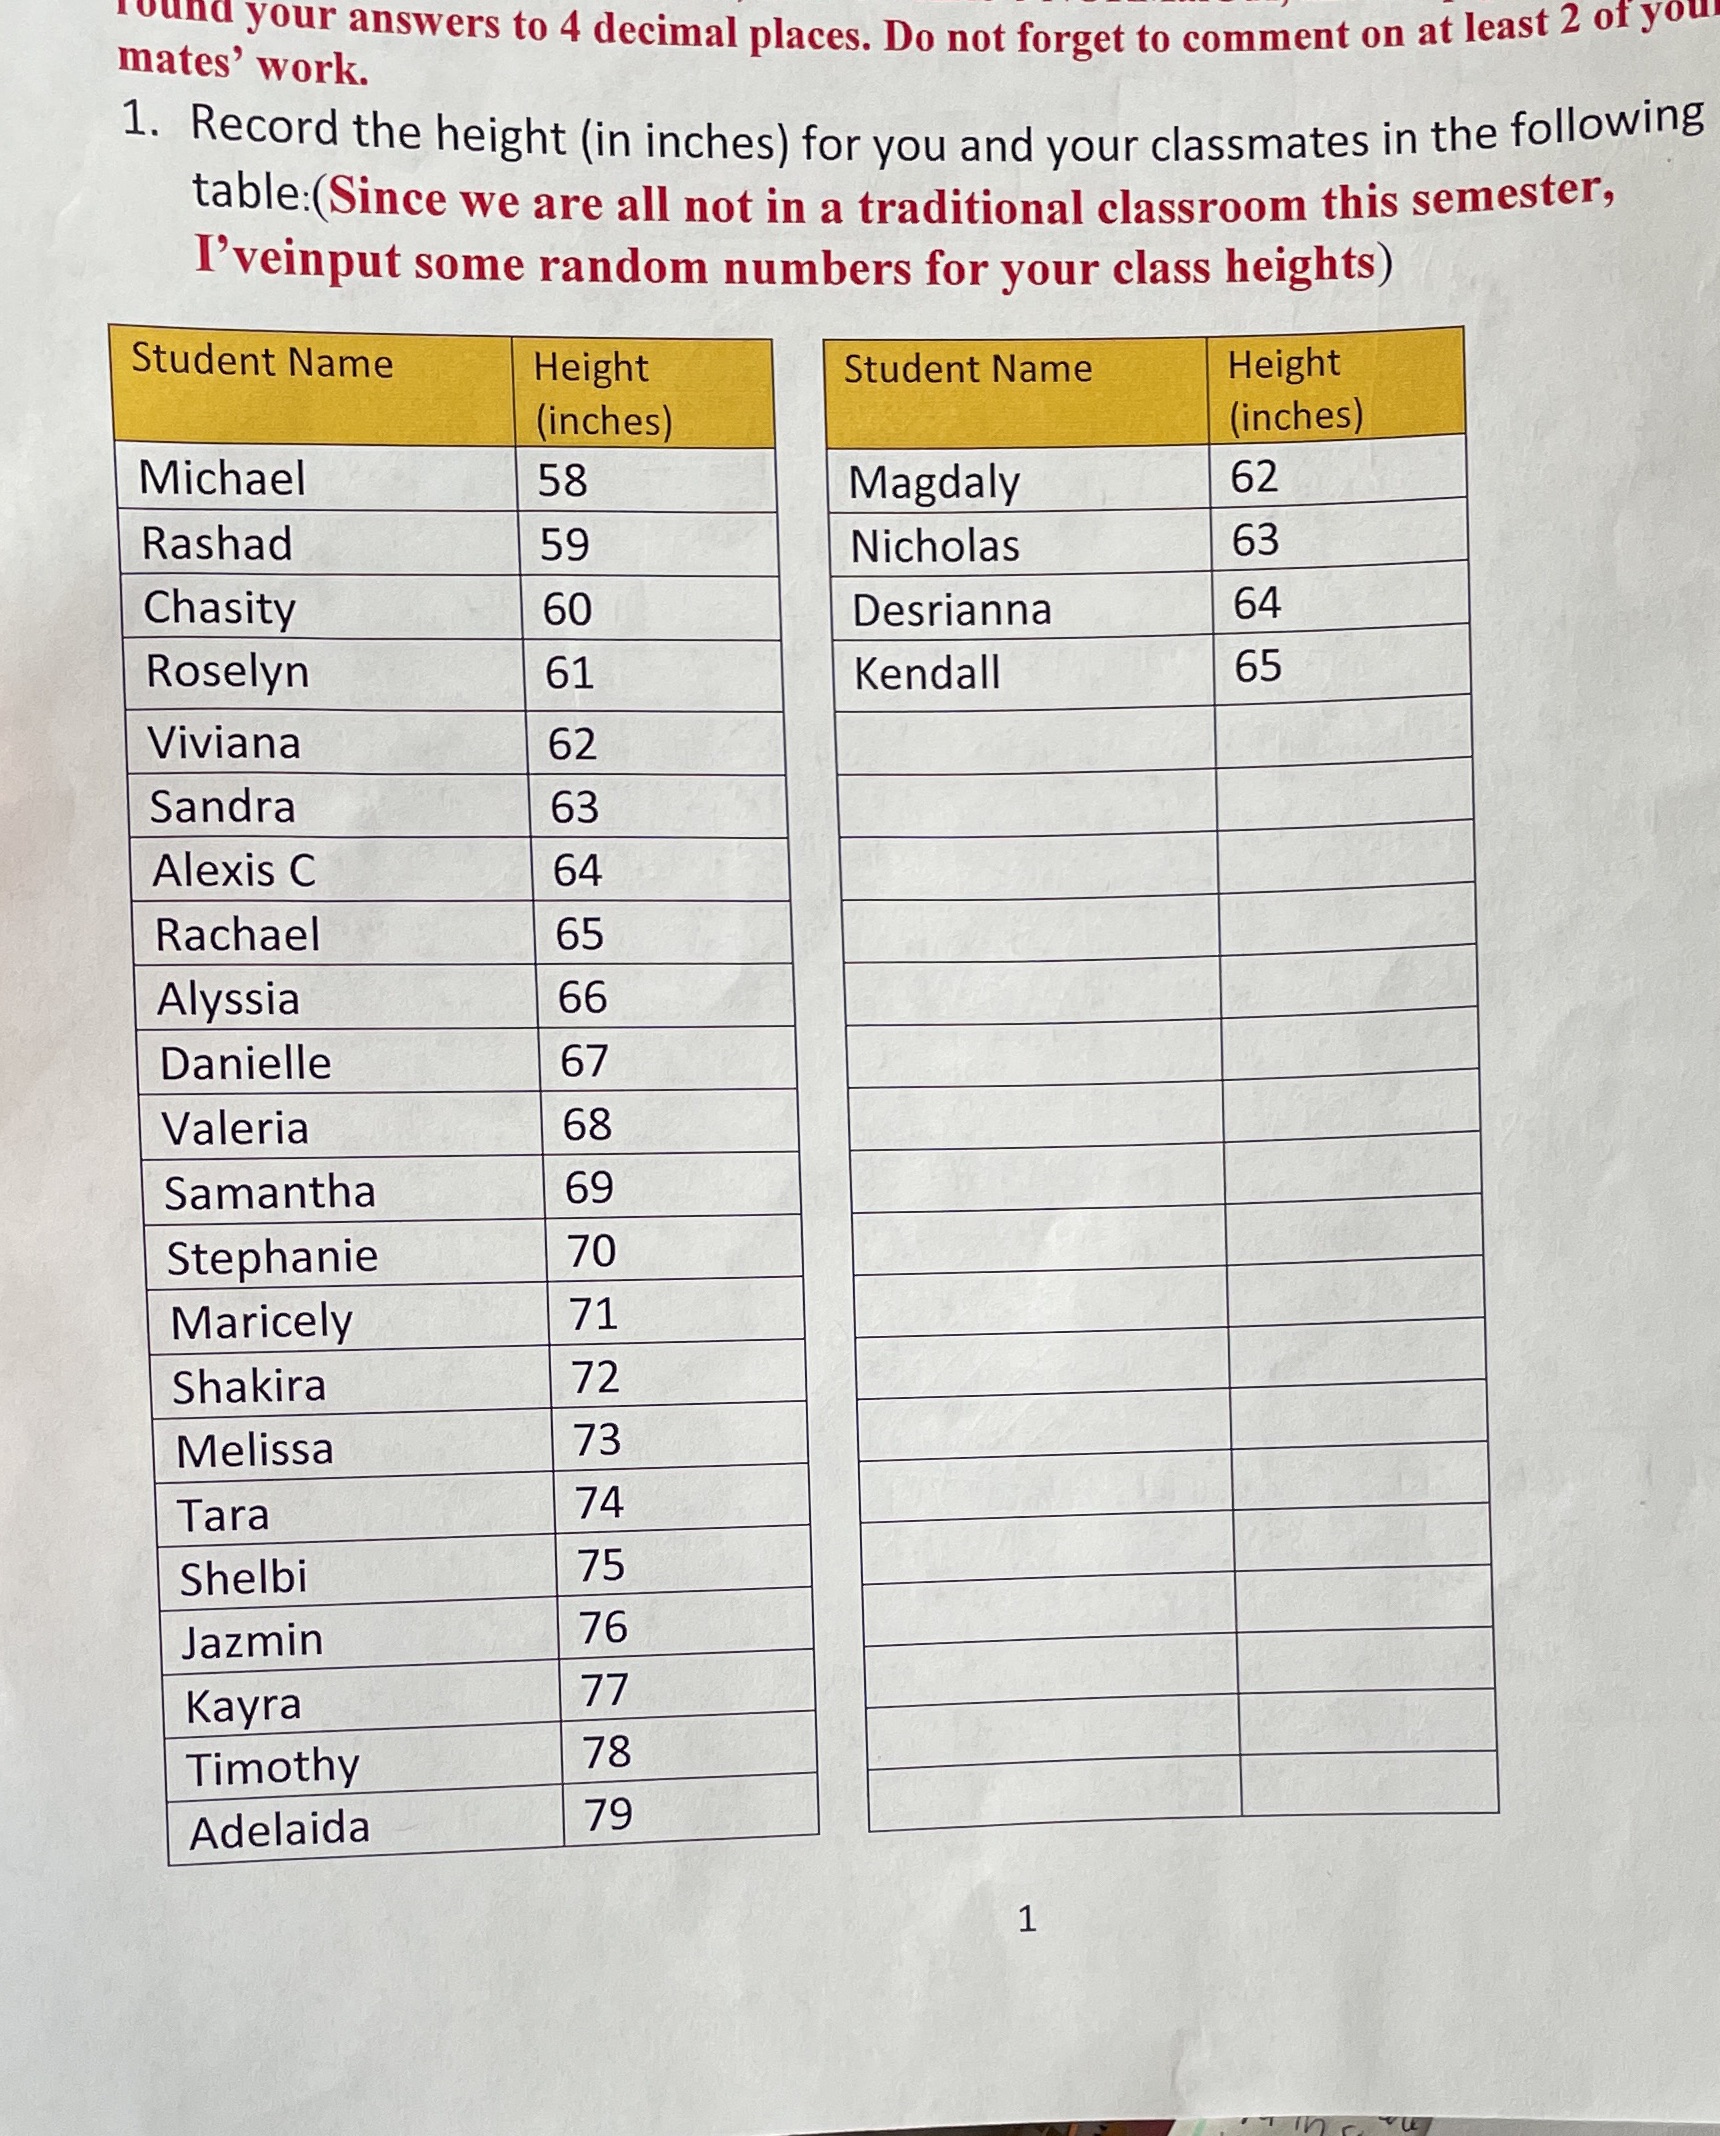
Hi I've tried to solve some of the problems, but I'm having a hard time doing some of them. I was wondering if I could get some clarity on a couple questions. The chart below is for the questions.1. Make a history gram of the data. Does it appear to be normal? Explain your reasoning. 2. Let's assume your data is normal, use the empirical rule to estimate how many students are between x and x+s inches.3. What percent of students heights lie between x-3s and x-s inches?
Step by Step Solution
There are 3 Steps involved in it
Step: 1

Get Instant Access to Expert-Tailored Solutions
See step-by-step solutions with expert insights and AI powered tools for academic success
Step: 2

Step: 3
Ace Your Homework with AI
Get the answers you need in no time with our AI-driven, step-by-step assistance
Get Started
Intermediate Algebra A Text/Workbook
Authors: Charles P McKeague
2nd Edition
1483214176, 9781483214177