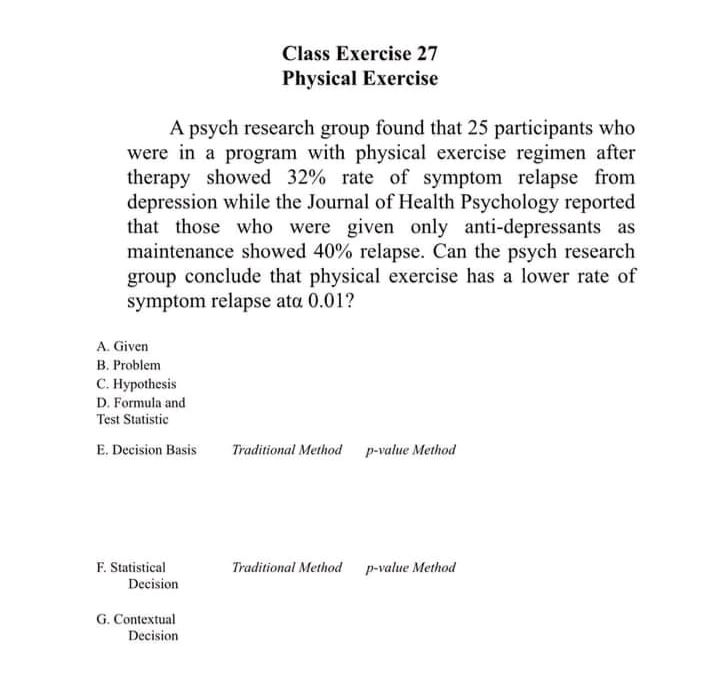
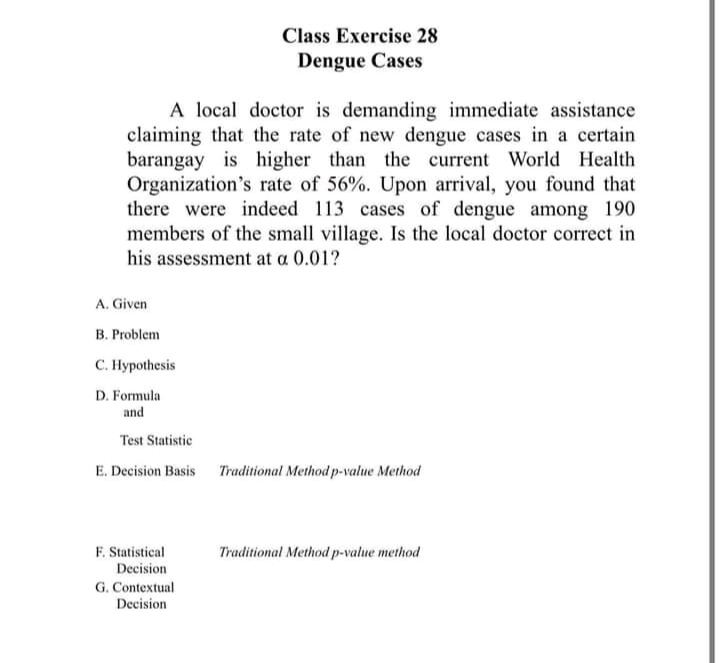
Hi looking for expert in Pysch Stat. I badly need it to pass this subject so please the expert one pls.
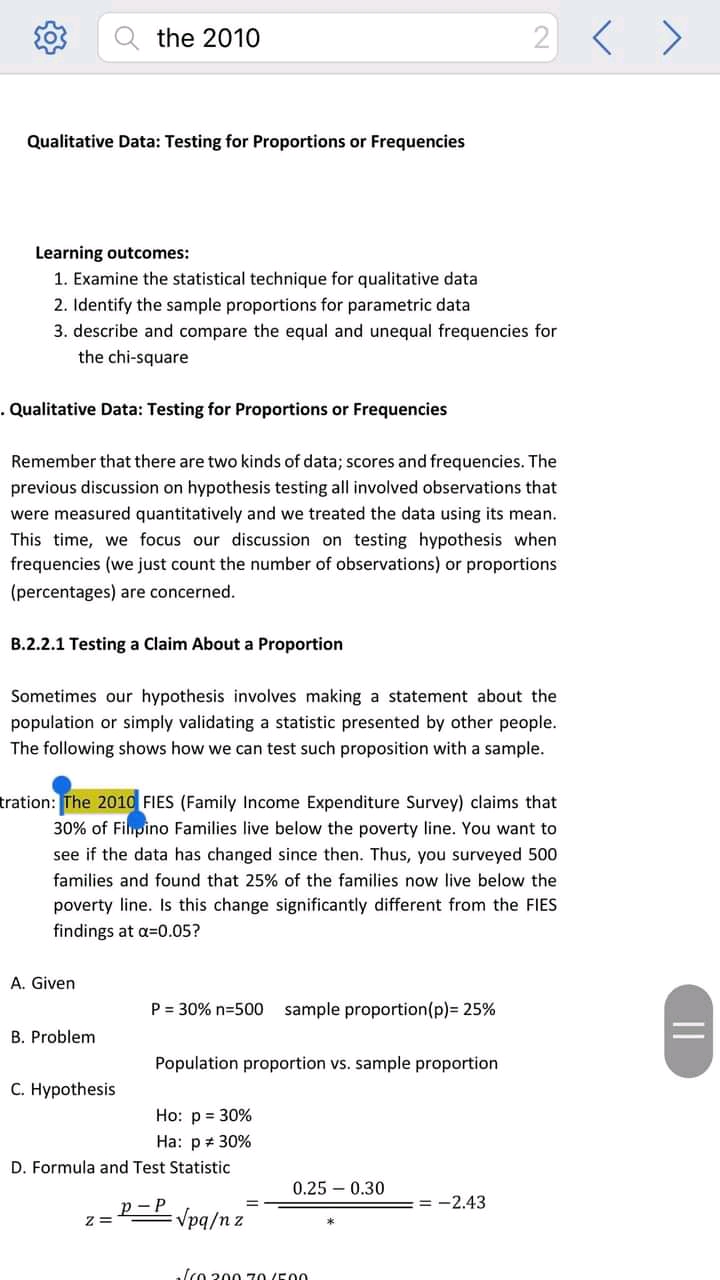
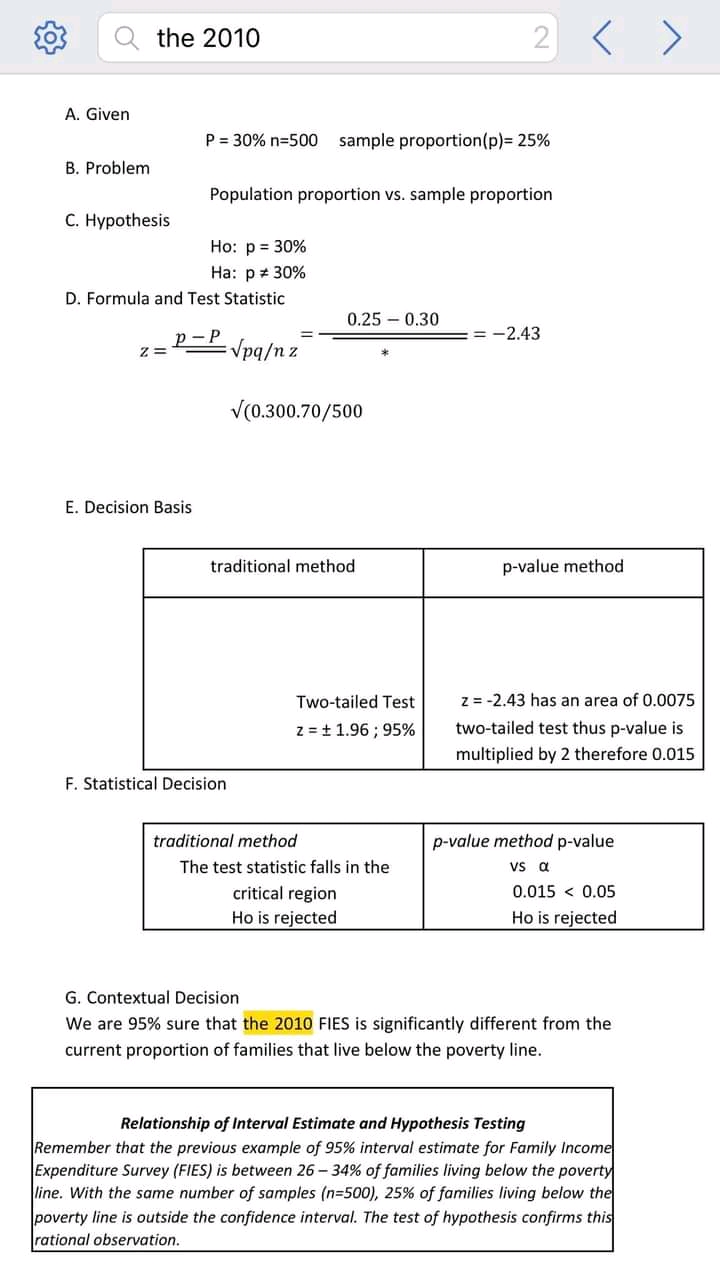
I also attached reference. It is a guide and example. Pls show compete solution.
Class Exercise 27 Physical Exercise A psych research group found that 25 participants who were in a program with physical exercise regimen after therapy showed 32% rate of symptom relapse from depression while the Journal of Health Psychology reported that those who were given only antidepressants as maintenance showed 40% relapse. Can the psych research group conclude that physical exercise has a lower rate of symptom relapse are 0.01? Ft. Given 13. Problem C. Hypothesis D. Formula and Test Sunni: E. Decision Basis ill-editions! Method far-value Method F. Statistical Maritime! Method pt'ahre Method Decision (3. Contextual Decision Class Exercise 23 Dengue Cases A local doctor is demanding immediate assistance claiming that the rate of new dengue cases in a certain barangay is higher than the current World Health Organization's rate of 56%. Upon arrival, you found that there were indeed 113 cases of dengue among 190 members of the small village. Is the local doctor correct in his assessment at a 0.01? A. Given B. Problem C. Hypothesis D. Funnels and Test sminie it. Decision Basis ill-editions! Mathew-mim- Method F. Statistical Traditional! Hermie-mine method Decision G. Contextual Decision the 2010 2 Qualitative Data: Testing for Proportions or Frequencies Learning outcomes: 1. Examine the statistical technique for qualitative data 2. Identify the sample proportions for parametric data 3. describe and compare the equal and unequal frequencies for the chi-square Qualitative Data: Testing for Proportions or Frequencies Remember that there are two kinds of data; scores and frequencies. The previous discussion on hypothesis testing all involved observations that were measured quantitatively and we treated the data using its mean. This time, we focus our discussion on testing hypothesis when frequencies (we just count the number of observations) or proportions (percentages) are concerned. B.2.2.1 Testing a Claim About a Proportion Sometimes our hypothesis involves making a statement about the population or simply validating a statistic presented by other people. The following shows how we can test such proposition with a sample. tration: The 2010 FIES (Family Income Expenditure Survey) claims that 30% of Filipino Families live below the poverty line. You want to see if the data has changed since then. Thus, you surveyed 500 families and found that 25% of the families now live below the poverty line. Is this change significantly different from the FIES findings at a=0.05? A. Given P = 30% n=500 sample proportion(p)= 25% B. Problem Population proportion vs. sample proportion C. Hypothesis Ho: p = 30% Ha: p # 30% D. Formula and Test Statistic 0.25 - 0.30 = -2.43 2 = P Vpqzthe 2010 2 A. Given P = 30% n=500 sample proportion(p)= 25% B. Problem Population proportion vs. sample proportion C. Hypothesis Ho: p = 30% Ha: p # 30% D. Formula and Test Statistic 0.25 - 0.30 2= P_ Vpqz =-2.43 (0.300.70/500 E. Decision Basis traditional method p-value method Two-tailed Test z= -2.43 has an area of 0.0075 z = + 1.96 ; 95% two-tailed test thus p-value is multiplied by 2 therefore 0.015 F. Statistical Decision traditional method p-value method p-value The test statistic falls in the vs a critical region 0.015
