Hi, need help for the statistics. It will be very appreciated if you are able to show the calculation!!! Thank you so much!!
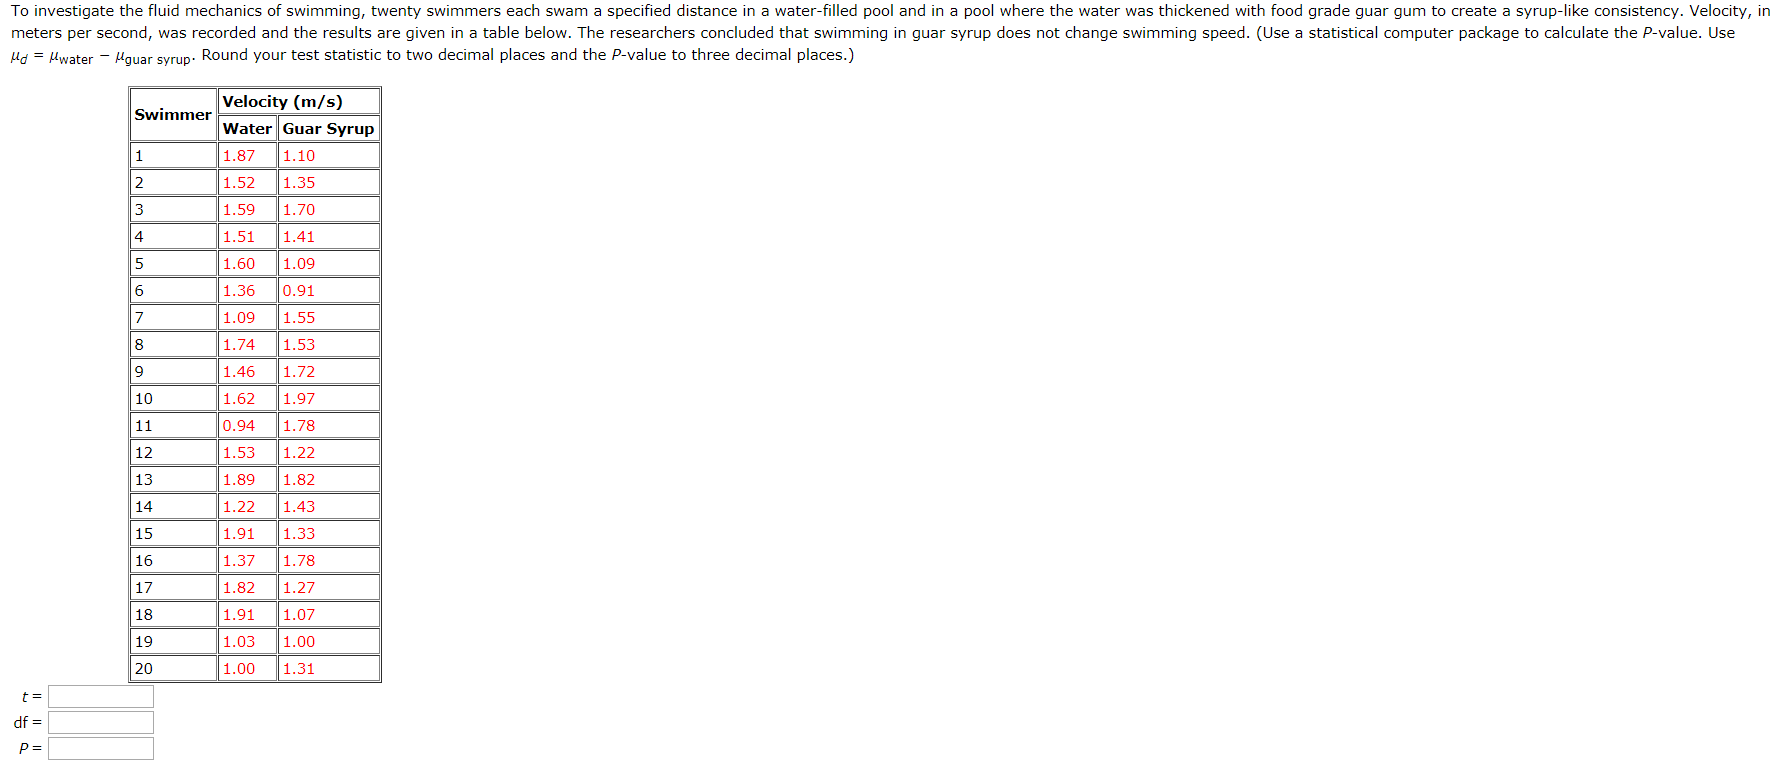
Some commercial airplanes recirculate approximately 50% of the cabin air in order to increase fuel efficiency. The researchers studied 1096 airline passengers, among which some traveled on airplanes that recirculated air and others traveled on planes that did not recirculate air. Of the 515 passengers who flew on planes that did not recirculate air, 104 reported post-flight respiratory symptoms, while 112 of the 581 passengers on planes that did recirculate air reported such symptoms. Is there sufficient evidence to conclude that the proportion of passengers with post-flight respiratory symptoms differs for planes that do and do not recirculate air? Test the appropriate hypotheses using a = 0.05. You may assume that it is reasonable to regard these two samples as being independently selected and as representative of the two populations of interest. (Use a statistical computer package to calculate the P-value. Use Pdo not recirculate - Pdo recirculate. Round your test statistic to two decimal places and your P-value to four decimal places.) Z = 0.38 P = 0.582The accompanying data were read from graphs that appeared in an article. The variables shown are the number of acres burned in forest fires in the western United States and timber sales. Number of Timber Sales Acres Burned Year (thousands) (billions of board feet) 1945 204 2.1 1950 259 3.6 1955 258 4.4 1960 376 7.0 1965 83 9.9 1970 441 11.1 1975 178 11.1 1980 233 10.3 1985 443 10.1 1990 397 10.9 1995 182 3.7 (a) Compute the correlation coefficient. (Give the answer to three decimal places.) r =To determine if chocolate milk was as effective as ot er carbohydrate replacement drinks, nine male cyclists performed an intense workout followed by a drink and a rest period. At the end of the rest period, each cyclist performed an endurance trial where he exercised until exhausted and time to exhaustion was measured. Each cyclist completed the entire regimen on two different days. On one day the drink provided was chocolate milk and on the other day the drink provided was a carbohydrate replacement drink. Data consistent with summary quantities appear in t e table below. (Use a statistical computer package to calculate the P-value. Subtract the carbohydrate replacement times from the chocolate milk times. Round your test statistic to two decimal places, your df down to the nearest whole number, and the Pivalue to three decimal places.) _ Time to Exhaustion (minutes) Cyclist 1 2 3 4 5 6 7 s 9 lmmam 55.47 22.12 21.03 44.59 52.21 28.93 51.76 30.25 27.19 ca'thVd'ate 20.28 25.77 34.88 16.10 38.10 39.91 30.35 9.79 10.42 Replacement To investigate the fluid mechanics of swimming, twenty swimmers each swam a specified distance in a water-filled pool and in a pool where the water was thickened with food grade guar gum to create a syrup-like consistency. Velocity, in meters per second, was recorded and the results are given in a table below. The researchers concluded that swimming in guar syrup does not change swimming speed. (Use a statistical computer package to calculate the P-value. Use Ud = Mwater - Mguar syrup. Round your test statistic to two decimal places and the P-value to three decimal places.) Swimmer Velocity (m/s) Water Guar Syrup 1 1.87 1.10 2 1.52 1.35 3 1.59 1.70 4 1.51 1.41 5 1.60 1.09 6 1.36 0.91 7 1.09 1.55 8 1.74 1.53 19 1.46 1.72 10 1.62 1.97 11 0.94 1.78 12 1.53 1.22 13 1.89 1.82 14 1.22 1.43 15 1.91 1.33 16 1.37 1.78 17 1.82 1.27 18 1.91 1.07 19 1.03 1.00 20 1.00 1.31 t= if = P =In a study of the effectiveness of a fabric device that acts like a support stocking for a weak or damaged heart, 110 people who consented to treatment were assigned at random to either a standard treatment consisting of drugs or the experimental treatment that consisted of drugs plus surgery to install the stocking. After two years, 40% of the 60 patients receiving the stocking had improved and 26% of the patients receiving the standard treatment had improved. (Use a statistical computer package to calculate the P-value. Use Pexperimental - Pstandard. Round your test statistic to two decimal places and your P-value to four decimal places.) Z = P = Do these data provide convincing evidence that the proportion of patients who improve is higher for the experimental treatment than for the standard treatment? Test the relevant hypotheses using a significance level of 0.05. Yes O No


