Answered step by step
Verified Expert Solution
Link Copied!

Question

1 Approved Answer

Hi, need help with lower and upper bound, thank you. The following data represent the commute time (in minutes) x and a score on a

Hi, need help with lower and upper bound, thank you.
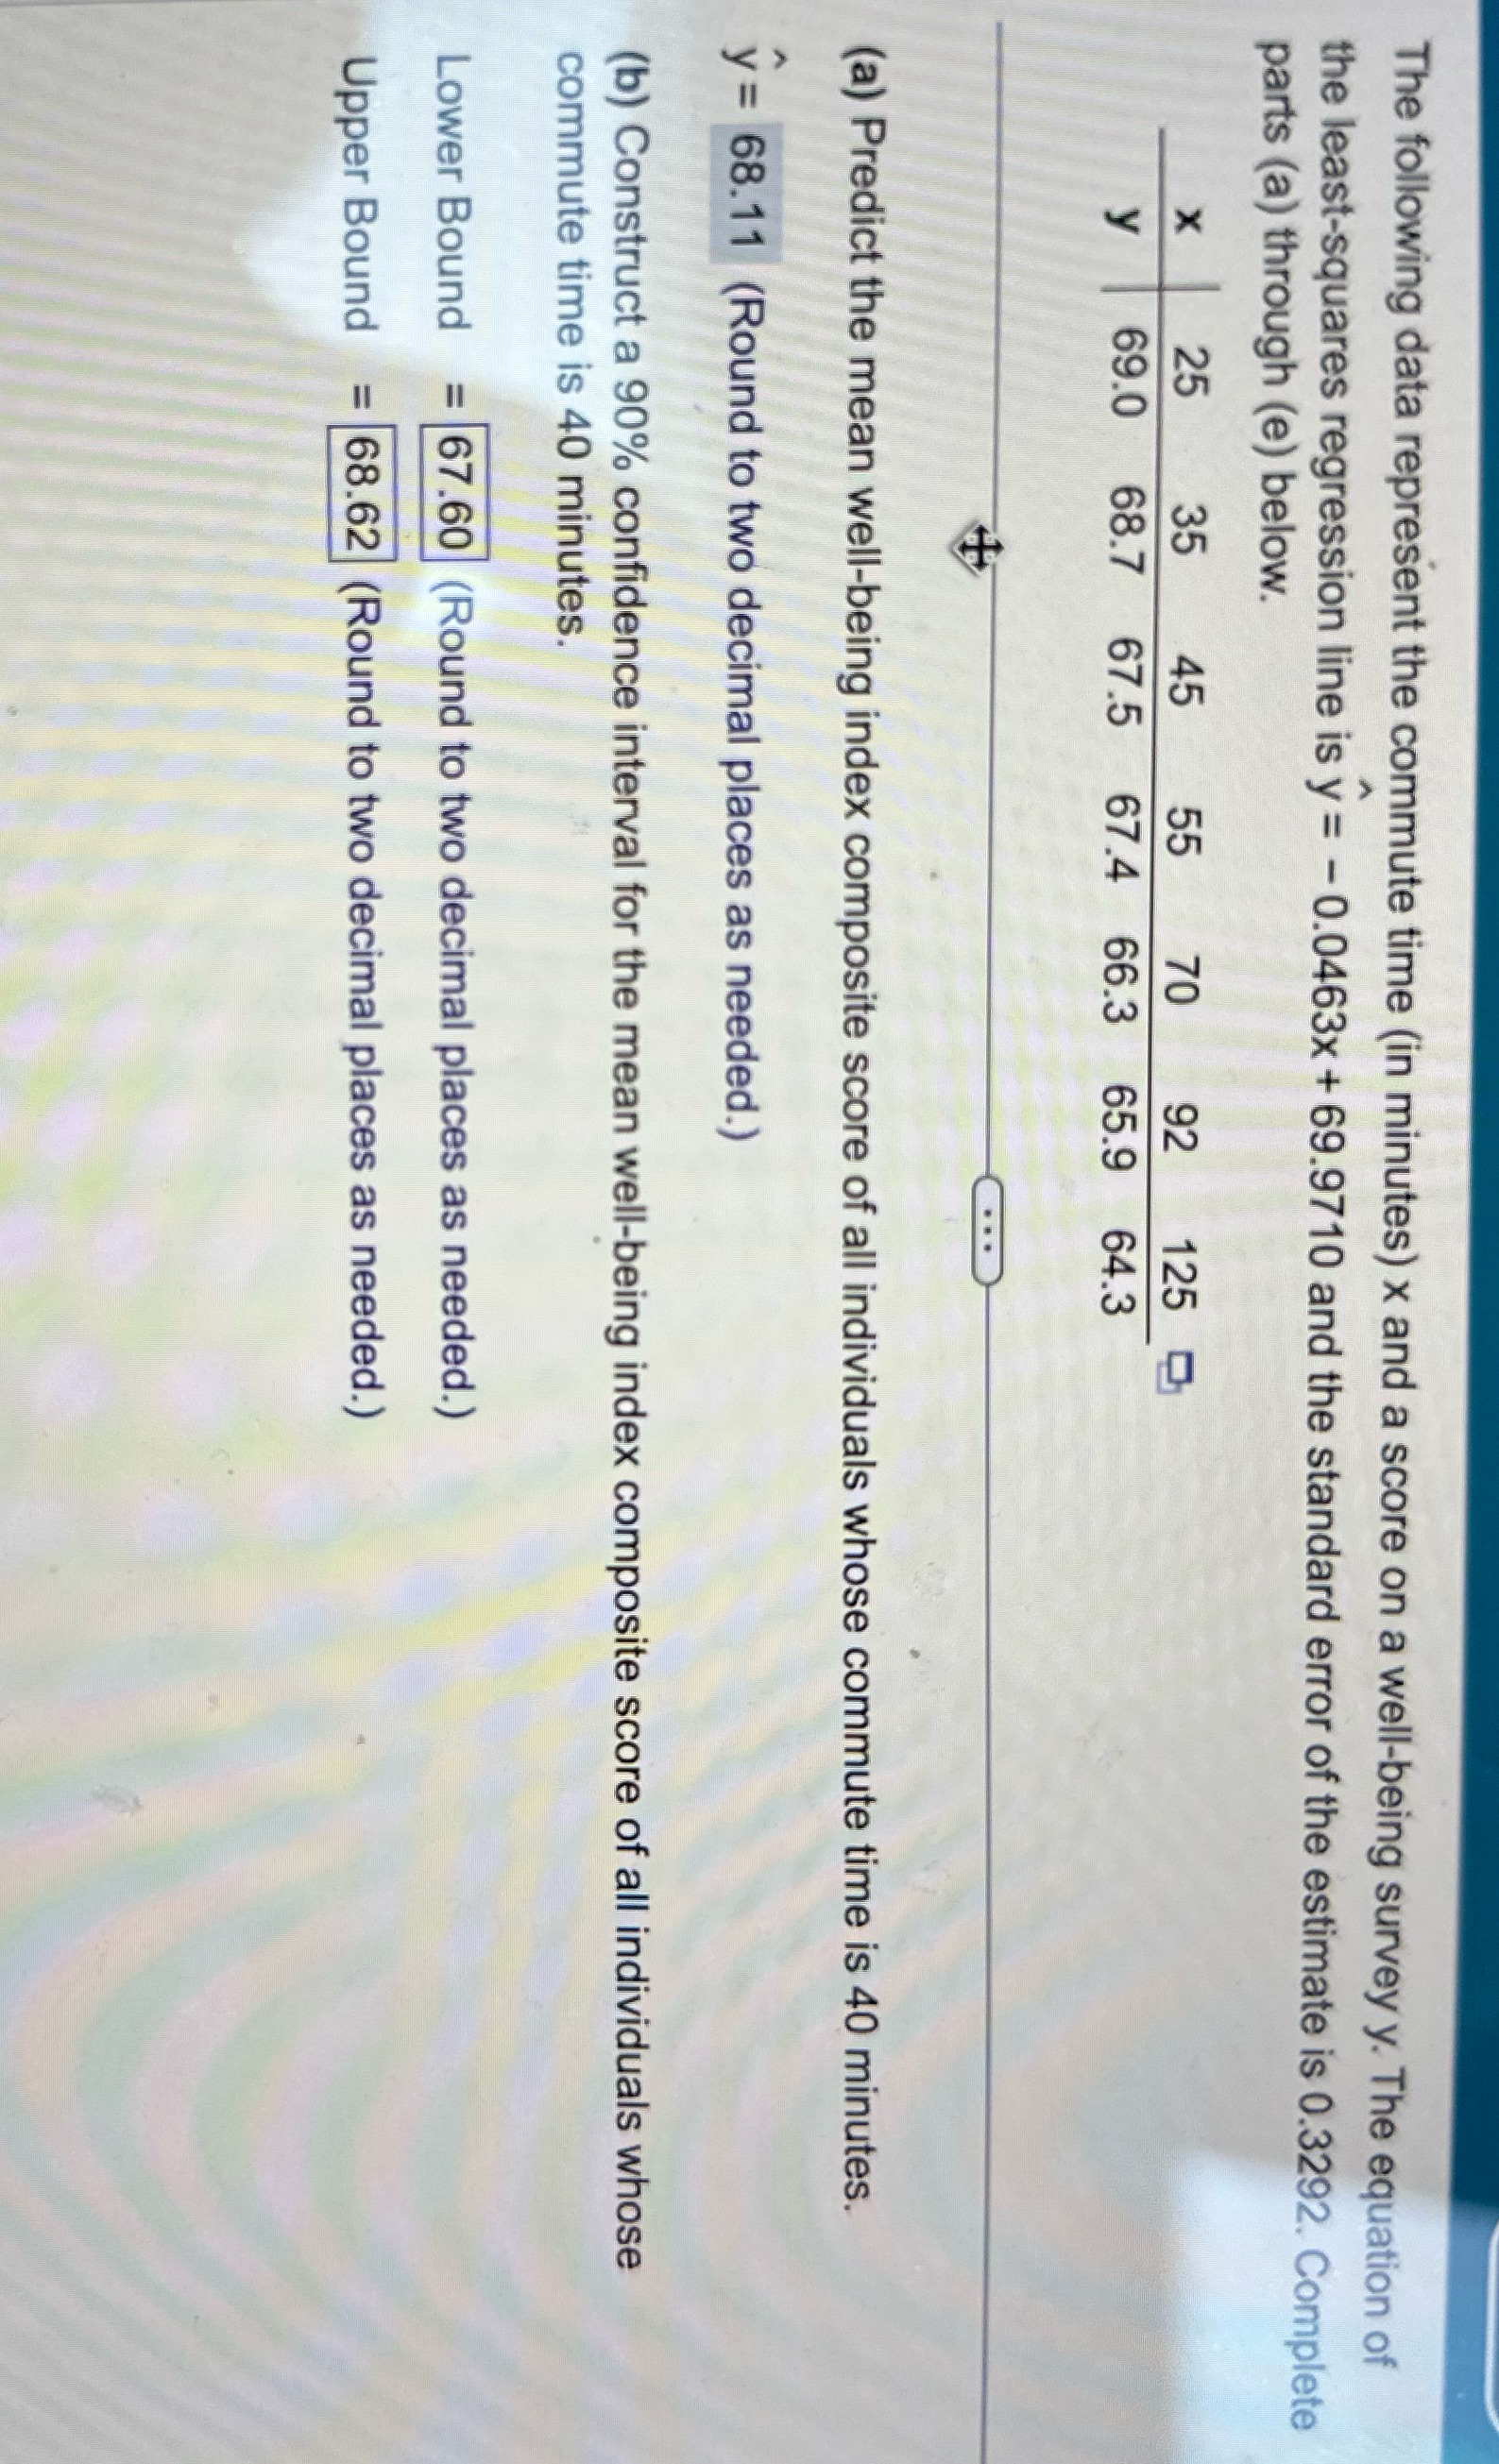
image text in transcribed
The following data represent the commute time (in minutes) x and a score on a well-being survey y. The equation of the least-squares regression line is y = - 0.0463x + 69.9710 and the standard error of the estimate is 0.3292. Complete parts (a) through (e) below. 25 125 0 69.0 68.7 67.5 67.4 66.3 65.9 64.3 . . . (a) Predict the mean well-being index composite score of all individuals whose commute time is 40 minutes. y = 68.11 (Round to two decimal places as needed.) (b) Construct a 90% confidence interval for the mean well-being index composite score of all individuals whose commute time is 40 minutes. Lower Bound = 67.60 (Round to two decimal places as needed.) Upper Bound = 68.62 (Round to two decimal places as needed.)

Step by Step Solution

There are 3 Steps involved in it

Step: 1

blur-text-image

Get Instant Access to Expert-Tailored Solutions

See step-by-step solutions with expert insights and AI powered tools for academic success

Step: 2

blur-text-image

Step: 3

blur-text-image

Ace Your Homework with AI

Get the answers you need in no time with our AI-driven, step-by-step assistance

Get Started

Recommended Textbook for

Quantitative Analysis For Management

Authors: Barry Render, Ralph M. Stair, Michael E. Hanna

11th Edition

9780132997621, 132149117, 132997622, 978-0132149112

Students also viewed these Mathematics questions