Hi please can I get some help with these questions
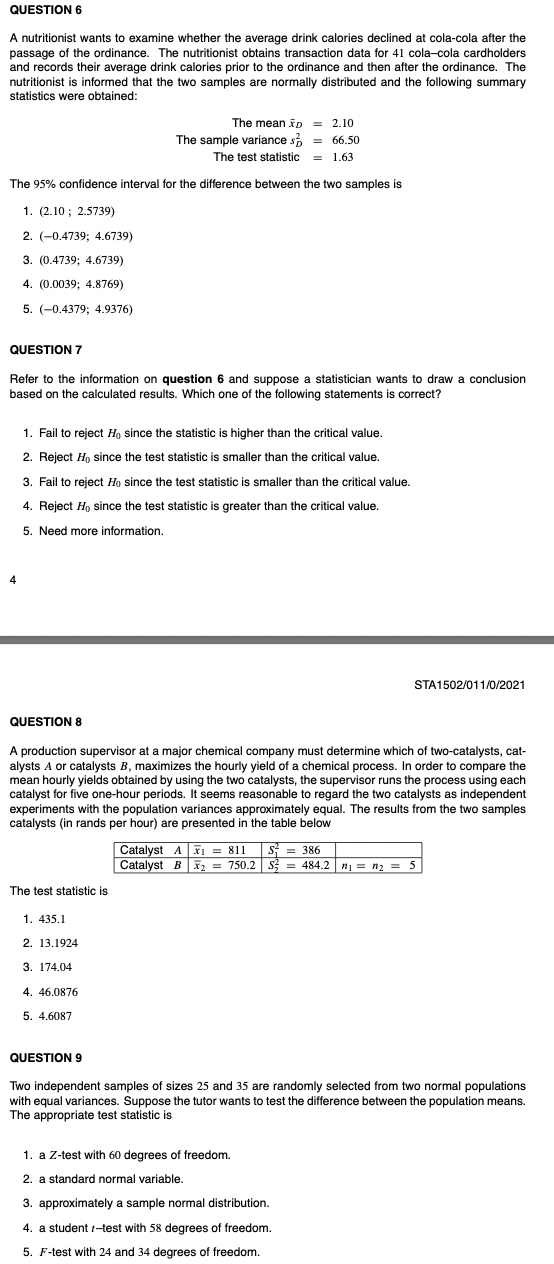
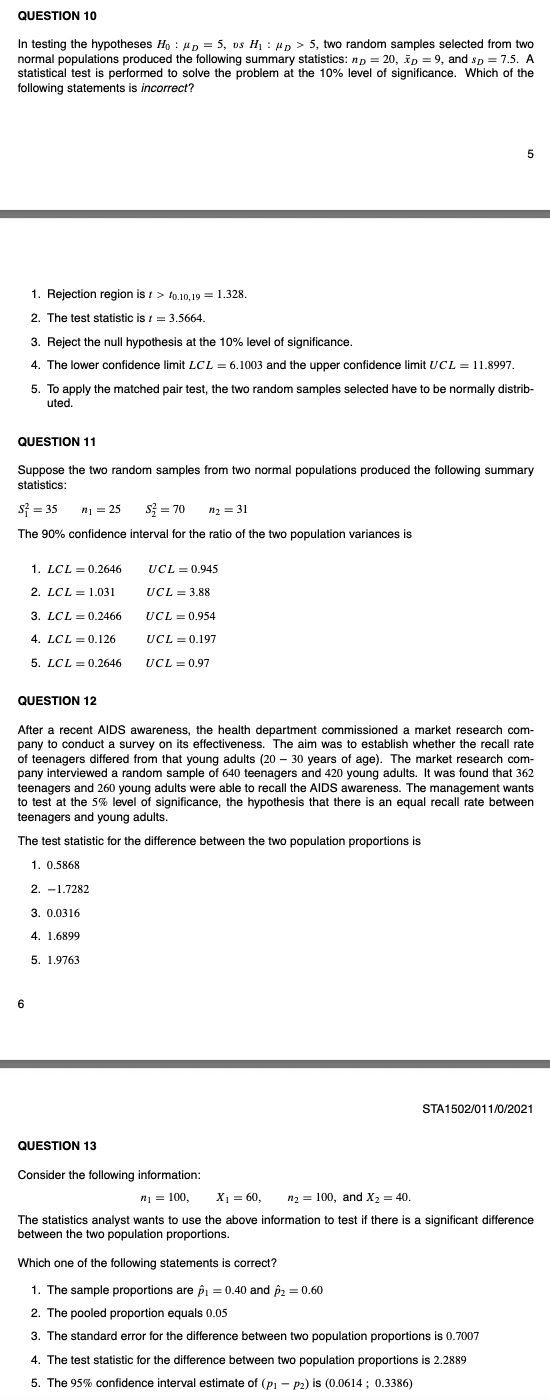
QUESTION 6 A nutritionist wants to examine whether the average drink calories declined at cola-cola after the passage of the ordinance. The nutritionist obtains transaction data for 41 cola-cola cardholders and records their average drink calories prior to the ordinance and then after the ordinance. The nutritionist is informed that the two samples are normally distributed and the following summary statistics were obtained: The mean XD = 2.10 The sample variance s = 66.50 The test statistic = 1.63 The 95% confidence interval for the difference between the two samples is 1. (2.10 ; 2.5739) 2. (-0.4739; 4.6739) 3. (0.4739; 4.6739) 4. (0.0039; 4.8769) 5. (-0.4379; 4.9376) QUESTION 7 Refer to the information on question 6 and suppose a statistician wants to draw a conclusion based on the calculated results. Which one of the following statements is correct? 1. Fail to reject Ho since the statistic is higher than the critical value. 2. Reject Ho since the test statistic is smaller than the critical value. 3. Fail to reject Ho since the test statistic is smaller than the critical value. 4. Reject Ho since the test statistic is greater than the critical value. 5. Need more information. STA1502/011/0/2021 QUESTION 8 A production supervisor at a major chemical company must determine which of two-catalysts, cat- alysts A or catalysts B, maximizes the hourly yield of a chemical process. In order to compare the mean hourly yields obtained by using the two catalysts, the supervisor runs the process using each catalyst for five one-hour periods. It seems reasonable to regard the two catalysts as independent experiments with the population variances approximately equal. The results from the two samples catalysts (in rands per hour) are presented in the table below Catalyst A X1 = 811 S = 386 Catalyst B X2 = 750.2 $5 = 484.2 nj = my = 5 The test statistic is 1. 435.1 2. 13.1924 3. 174.04 4. 46.0876 5. 4.6087 QUESTION 9 Two independent samples of sizes 25 and 35 are randomly selected from two normal populations with equal variances. Suppose the tutor wants to test the difference between the population means. The appropriate test statistic is 1. a Z-test with 60 degrees of freedom. 2. a standard normal variable. 3. approximately a sample normal distribution. 4. a student /-test with 58 degrees of freedom. 5. F-test with 24 and 34 degrees of freedom.QUESTION 10 In testing the hypotheses Ho : #p = 5, os Hi : up > 5, two random samples selected from two normal populations produced the following summary statistics: mp = 20, ap = 9, and sp = 7.5. A statistical test is performed to solve the problem at the 10% level of significance. Which of the following statements is incorrect? 5 1. Rejection region is / > fo.10,19 = 1.328. 2. The test statistic is / = 3.5664. 3. Reject the null hypothesis at the 10% level of significance. 4. The lower confidence limit LCL = 6.1003 and the upper confidence limit UCL = 11.8997. 5. To apply the matched pair test, the two random samples selected have to be normally distrib uted. QUESTION 11 Suppose the two random samples from two normal populations produced the following summary statistics: $4 = 35 71 = 25 $, = 70 12 = 31 The 90% confidence interval for the ratio of the two population variances is 1. LCL = 0.2646 UCL = 0.945 2. LCL = 1.031 UCL = 3.88 3. LCL = 0.2466 UCL = 0.954 4. LCL = 0.126 UCL = 0.197 5. LCL = 0.2646 UCL = 0.97 QUESTION 12 After a recent AIDS awareness, the health department commissioned a market research com- pany to conduct a survey on its effectiveness. The aim was to establish whether the recall rate of teenagers differed from that young adults (20 - 30 years of age). The market research com- pany interviewed a random sample of 640 teenagers and 420 young adults. It was found that 362 teenagers and 260 young adults were able to recall the AIDS awareness. The management wants to test at the 5% level of significance, the hypothesis that there is an equal recall rate between teenagers and young adults. The test statistic for the difference between the two population proportions is 1. 0.5868 2. -1.7282 3. 0.0316 4. 1.6899 5. 1.9763 STA1502/011/0/2021 QUESTION 13 Consider the following information: 71 = 100, X1 = 60, n2 = 100, and X2 = 40. The statistics analyst wants to use the above information to test if there is a significant difference between the two population proportions. Which one of the following statements is correct? 1. The sample proportions are p1 = 0.40 and p2 = 0.60 2. The pooled proportion equals 0.05 3. The standard error for the difference between two population proportions is 0.7007 4. The test statistic for the difference between two population proportions is 2.2889 5. The 95% confidence interval estimate of (p1 - p2) is (0.0614 ; 0.3386)