 hI please show formulas! Thank you

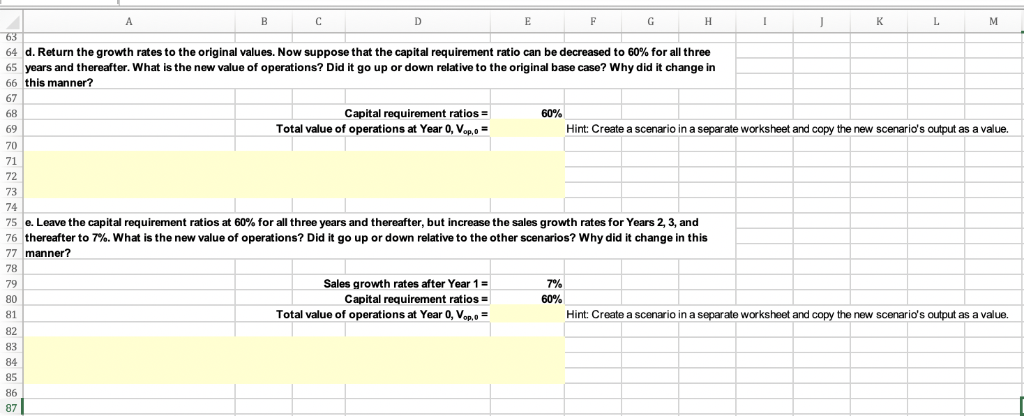
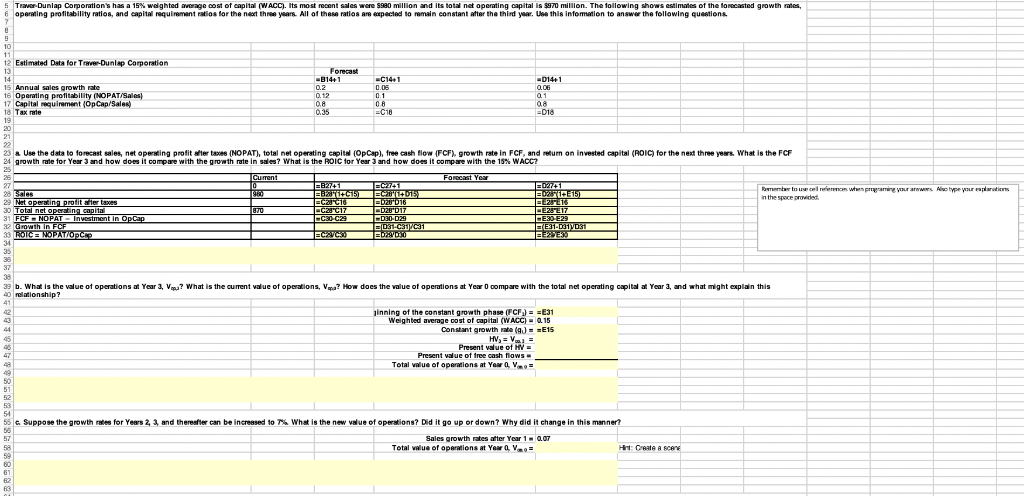
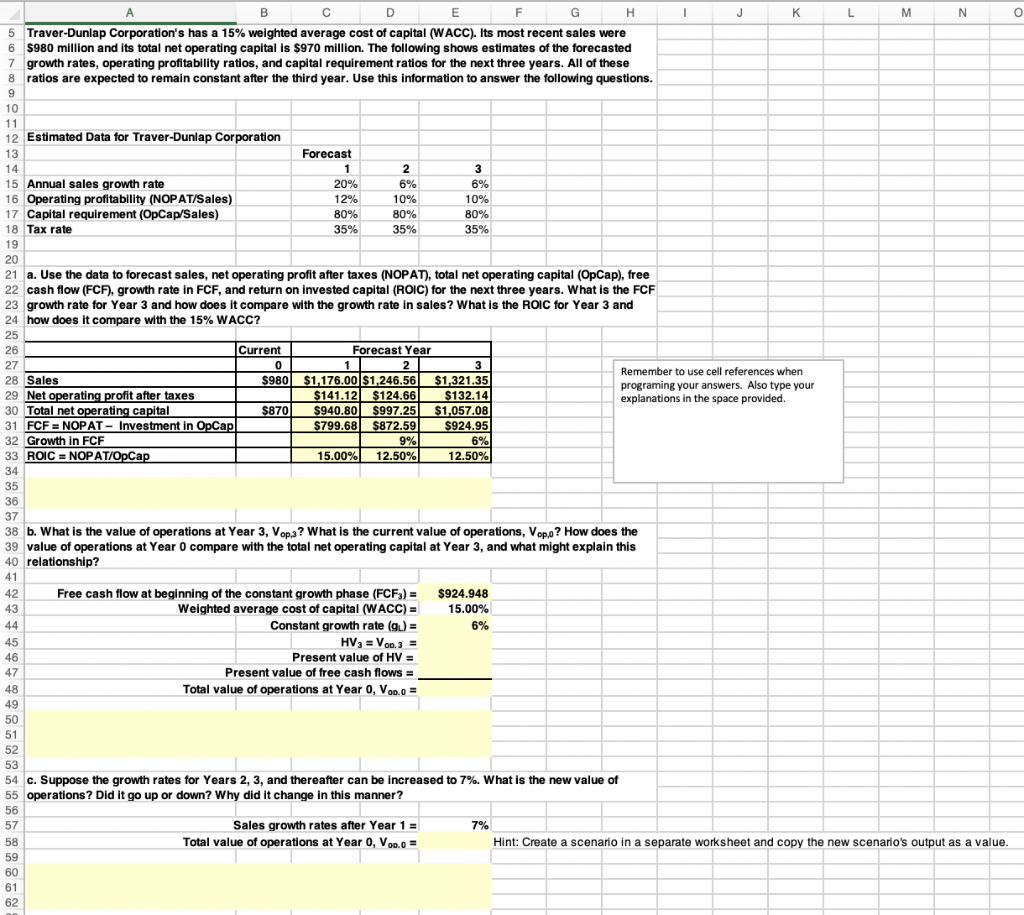
64 d. Return the growth rates to the original values. Now suppose that the capital requirement ratio can be decreased to 60% for all three 65 years and thereafter. What is the new value of operations? Did it go up or down relative to the original base case? Why did it change in 66 this manner? 67 Capital requirement ratios Total value of operations at Year 0, Vop,o Hint: Create a scenario in a separate worksheet and copy the new scenario's output as a value. 70 71 72 73 74 75 e. Leave the capital requirement ratios at 60% for all three years and thereafter, but increase the sales growth rates for Years 2, 3, and 76 thereafter to 7%. What is the new value of operations? Did it go up or down relative to the other scenarios? Why did it change in this 77 manner? 78 79 80 81 82 83 Sales growth rates after Year 1 = Capital requirement ratios. Total value of operations at Year 0, Vop,o Hint: Create a scenario in a separate worksheet and copy the new scenario's output as a value. 85 87 5 6 Traver Dunlap Corporation's has a 19% woighted an a e oost of capital (NACC). Its most recent sales wo e SS 0 million and its total net openting oapital is 970 million. The lollowing shows estimates of the too ope nting profitability ratios, and capital raquim ant atsoa torthe next th years. All ol thes ratios ame pected to fan ain constant after the third gar Use this info tation to answer the following question ted growth rat 12 Estimated Data for Traver-Dunlap Corporation 13 Forecast 014+ 5 Annual sales growth ate 16 Operating profitability (NOPAT Sales 17 Capital requirement (OpCap Sales) 8 Tax rate 19 0.8 0.35 08 -C18 08 018 23 & Use the data to forecast sales, net operating profit after taxes (NOPAT total net perating capita' (OpCap), free cash flow FCF growth rate in FCF, and return on invested capitalROIC) for the nethree years what is the FCF 24 growth rate for Year 3 and how does it compare with the growth rate in sales? what is the ROIC lor Year 3 and how does it compare with the 1% wACC? n the spoce provided 031-C31 34 38 e b. what is the value of operations at Year 3 V? What is the current value of Operations, Vapa? How does the value of operations at Year 0 oompare with the total net operating capital Year 3 and what might explan this linning of the constant growth pha (FCFJ =-E31 Weighted average oost of capital (WACC) Q.15 Constant growth rate (g)E15 Present value ot N Total alue of opertions at Year , V 50 54 55Suppose the growth rates for Yeer$2, 3, and thereafter can be increased to 7% what is the new value of operations? Did it go up or down? why did it change in this manner? Sales growth rates ater Year 1-0.07 Total value of operations at Year a rt: Create a = 80 5 Traver-Dunlap Corporation's has a 15% weighted average cost of capital (WACC). lts most recent sales were 6 $980 million and its total net operating capital is $970 million. The following shows estimates of the forecasted 7 growth rates, operating profitability ratios, and capital requirement ratios for the next three years. All of these 8ratios are expected to remain constant after the third year. Use this information to answer the following questions. 10 12 Estimated Data for Traver-Dunlap Corporation 13 14 15 Annual sales growth rate 16 Operating profitability (NOPAT/Sales) 17 Capital requirement (OpCap/Sales) 18 Tax rate 19 20 21 a. Use the data to forecast sales, net operating profit after taxes (NOPAT), total net operating capital (OpCap), free 22 cash flow (FCF), growth rate in FCF, and return on invested capital (ROIC) for the next three years. What is the FCF 23 growth rate for Year 3 and how does it compare with the growth rate in sales? What is the ROIC for Year 3 and 24 how does it compare with the 15% WACC? 25 26 27 28 Sales 29 Net operati 30 Total net operating capital 31 FCF NOPAT-Investment in OpCa 32 Growth in FCF 33 ROIC NOPAT/OpCa Forecast 6% 10% 12% 80% 35% 10% 35% 35% Current Forecast Year Remember to use cell references when programing your answers. Also type your explanations in the space provided. S980$1,176.00 $1,246.56$1,321.35 $132.14 70 $940.80 $997.25 $1,057.08 924.95 6% 12.50% ofit after taxes S141.12 $124.66 S799.68$87 15.00% 12.50% 872.59 35 37 38 b. What is the value of operations at Year 3, Vopa? What is the current value of operations, Vop,? How does the 39 value of operations at Year 0 compare with the total net operating capital at Year 3, and what might explain this 40 relationship? 41 42 Free cash flow at beginning of the constant growth phase (FCFs) $924.948 weighted average cost of capital (WACC)-15.00% Constant growth rate (gu) 45 Present value of HV Present value of free cash flows 47 Total value of operations at Year 0,V00.0 49 51 52 54 c. Suppose the growth rates for Years 2, 3, and thereafter can be increased to 7%. What is the new value of 55 operations? Did it go up or down? Why did it change in this manner? 57 Sales growth rates after Year 1 = Total value of operations at Year 0, Vo0.0 Hint: Create a scenario in a separate worksheet and copy the new scenario's output as a value 59 61 62 64 d. Return the growth rates to the original values. Now suppose that the capital requirement ratio can be decreased to 60% for all three 65 years and thereafter. What is the new value of operations? Did it go up or down relative to the original base case? Why did it change in 66 this manner? 67 Capital requirement ratios Total value of operations at Year 0, Vop,o Hint: Create a scenario in a separate worksheet and copy the new scenario's output as a value. 70 71 72 73 74 75 e. Leave the capital requirement ratios at 60% for all three years and thereafter, but increase the sales growth rates for Years 2, 3, and 76 thereafter to 7%. What is the new value of operations? Did it go up or down relative to the other scenarios? Why did it change in this 77 manner? 78 79 80 81 82 83 Sales growth rates after Year 1 = Capital requirement ratios. Total value of operations at Year 0, Vop,o Hint: Create a scenario in a separate worksheet and copy the new scenario's output as a value. 85 87 5 6 Traver Dunlap Corporation's has a 19% woighted an a e oost of capital (NACC). Its most recent sales wo e SS 0 million and its total net openting oapital is 970 million. The lollowing shows estimates of the too ope nting profitability ratios, and capital raquim ant atsoa torthe next th years. All ol thes ratios ame pected to fan ain constant after the third gar Use this info tation to answer the following question ted growth rat 12 Estimated Data for Traver-Dunlap Corporation 13 Forecast 014+ 5 Annual sales growth ate 16 Operating profitability (NOPAT Sales 17 Capital requirement (OpCap Sales) 8 Tax rate 19 0.8 0.35 08 -C18 08 018 23 & Use the data to forecast sales, net operating profit after taxes (NOPAT total net perating capita' (OpCap), free cash flow FCF growth rate in FCF, and return on invested capitalROIC) for the nethree years what is the FCF 24 growth rate for Year 3 and how does it compare with the growth rate in sales? what is the ROIC lor Year 3 and how does it compare with the 1% wACC? n the spoce provided 031-C31 34 38 e b. what is the value of operations at Year 3 V? What is the current value of Operations, Vapa? How does the value of operations at Year 0 oompare with the total net operating capital Year 3 and what might explan this linning of the constant growth pha (FCFJ =-E31 Weighted average oost of capital (WACC) Q.15 Constant growth rate (g)E15 Present value ot N Total alue of opertions at Year , V 50 54 55Suppose the growth rates for Yeer$2, 3, and thereafter can be increased to 7% what is the new value of operations? Did it go up or down? why did it change in this manner? Sales growth rates ater Year 1-0.07 Total value of operations at Year a rt: Create a = 80 5 Traver-Dunlap Corporation's has a 15% weighted average cost of capital (WACC). lts most recent sales were 6 $980 million and its total net operating capital is $970 million. The following shows estimates of the forecasted 7 growth rates, operating profitability ratios, and capital requirement ratios for the next three years. All of these 8ratios are expected to remain constant after the third year. Use this information to answer the following questions. 10 12 Estimated Data for Traver-Dunlap Corporation 13 14 15 Annual sales growth rate 16 Operating profitability (NOPAT/Sales) 17 Capital requirement (OpCap/Sales) 18 Tax rate 19 20 21 a. Use the data to forecast sales, net operating profit after taxes (NOPAT), total net operating capital (OpCap), free 22 cash flow (FCF), growth rate in FCF, and return on invested capital (ROIC) for the next three years. What is the FCF 23 growth rate for Year 3 and how does it compare with the growth rate in sales? What is the ROIC for Year 3 and 24 how does it compare with the 15% WACC? 25 26 27 28 Sales 29 Net operati 30 Total net operating capital 31 FCF NOPAT-Investment in OpCa 32 Growth in FCF 33 ROIC NOPAT/OpCa Forecast 6% 10% 12% 80% 35% 10% 35% 35% Current Forecast Year Remember to use cell references when programing your answers. Also type your explanations in the space provided. S980$1,176.00 $1,246.56$1,321.35 $132.14 70 $940.80 $997.25 $1,057.08 924.95 6% 12.50% ofit after taxes S141.12 $124.66 S799.68$87 15.00% 12.50% 872.59 35 37 38 b. What is the value of operations at Year 3, Vopa? What is the current value of operations, Vop,? How does the 39 value of operations at Year 0 compare with the total net operating capital at Year 3, and what might explain this 40 relationship? 41 42 Free cash flow at beginning of the constant growth phase (FCFs) $924.948 weighted average cost of capital (WACC)-15.00% Constant growth rate (gu) 45 Present value of HV Present value of free cash flows 47 Total value of operations at Year 0,V00.0 49 51 52 54 c. Suppose the growth rates for Years 2, 3, and thereafter can be increased to 7%. What is the new value of 55 operations? Did it go up or down? Why did it change in this manner? 57 Sales growth rates after Year 1 = Total value of operations at Year 0, Vo0.0 Hint: Create a scenario in a separate worksheet and copy the new scenario's output as a value 59 61 62
 hI please show formulas! Thank you


