Answered step by step
Verified Expert Solution
Link Copied!

Question

1 Approved Answer

Hi, The task is to Identify one error in each section (there can be more than one) and comment on what should have been written

Hi,

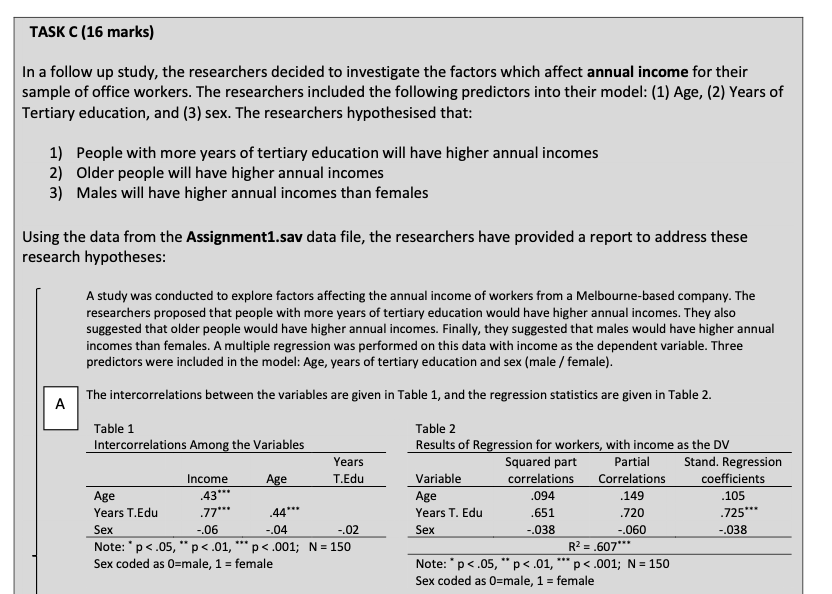
The task is to "Identify one error in each section (there can be more than one) and comment on what should have been written instead (you will have to run an analysis on the data yourself to check)".

I cannot for the life of me, identify the error in this statement. I would love some fresh eyes on this, to be able to determine the correct answer.

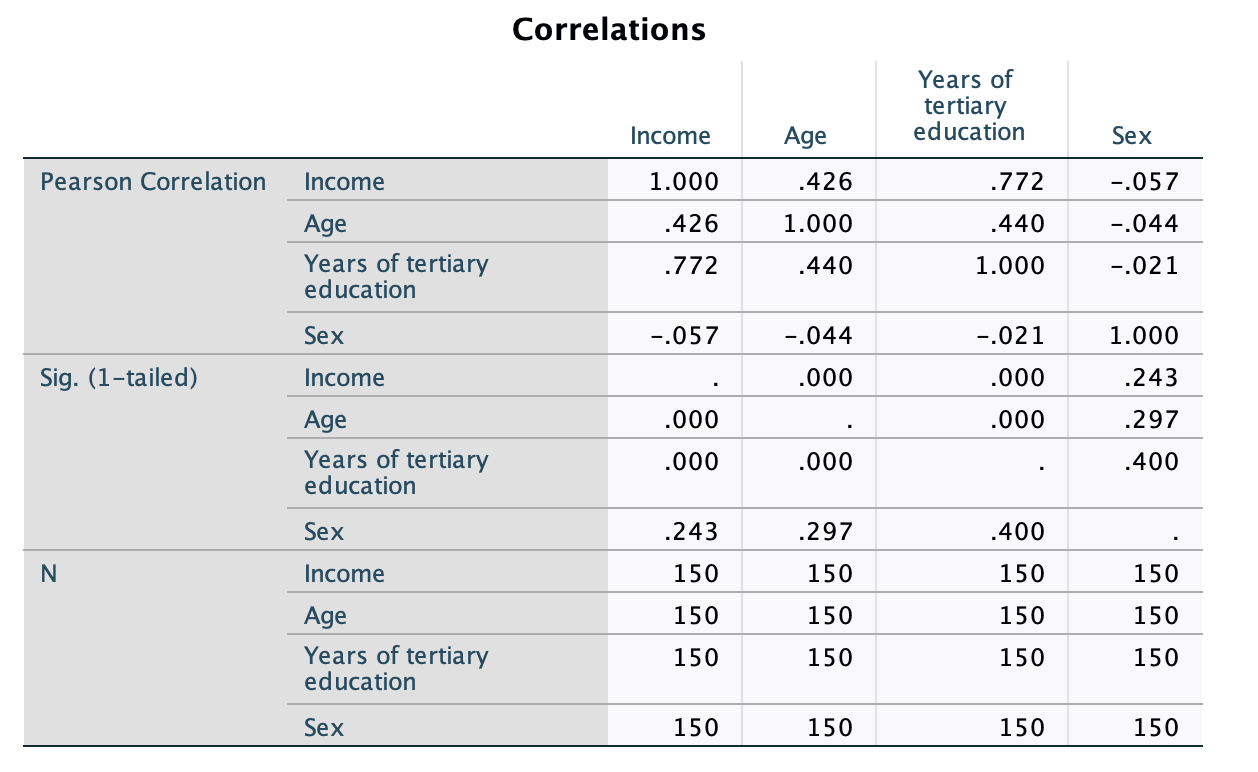
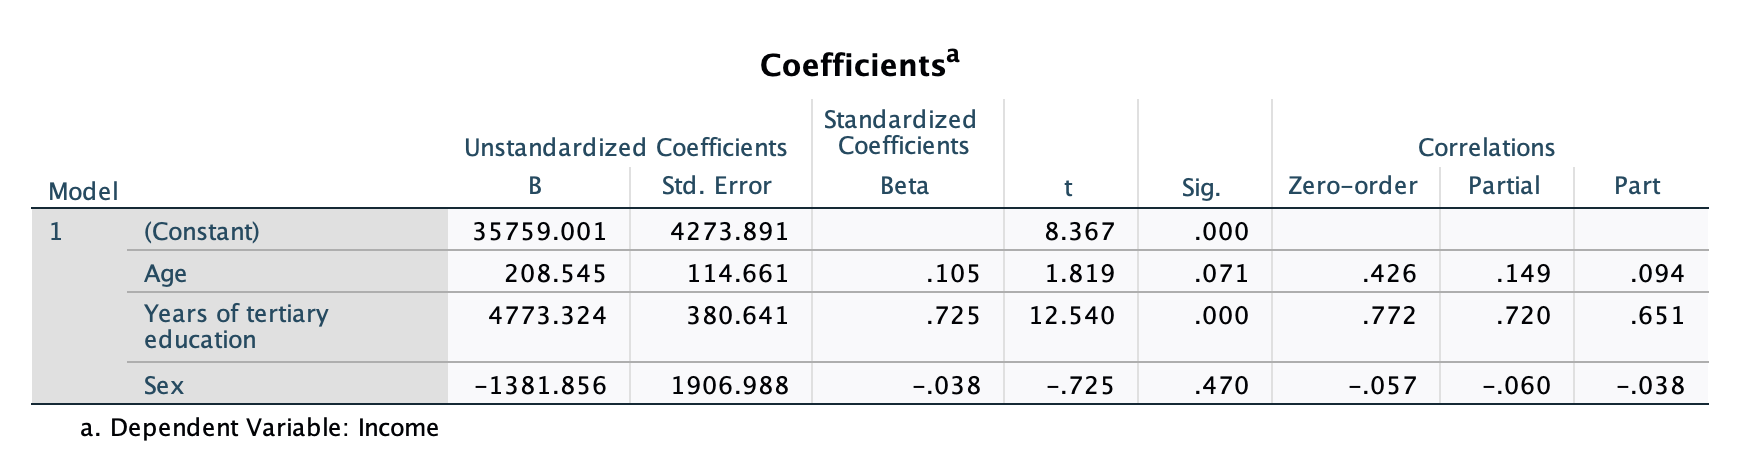
Attached is the assessment sheet with the section A of which I am trying to identify the error. Attached also, are my personal SPSS analysis that I independently ran to check the statement.

Note: the error could be in the wording, or the statistical analysis.

image text in transcribedimage text in transcribedimage text in transcribed
TASK C (16 marks) In a follow up study, the researchers decided to investigate the factors which affect annual income for their sample of office workers. The researchers included the following predictors into their model: (1) Age, (2) Years of Tertiary education, and (3) sex. The researchers hypothesised that: 1) People with more years of tertiary education will have higher annual incomes 2) Older people will have higher annual incomes 3) Males will have higher annual incomes than females Using the data from the Assignment1.sav data file, the researchers have provided a report to address these research hypotheses: A study was conducted to explore factors affecting the annual income of workers from a Melbourne-based company. The researchers proposed that people with more years of tertiary education would have higher annual incomes. They also suggested that older people would have higher annual incomes. Finally, they suggested that males would have higher annual incomes than females. A multiple regression was performed on this data with income as the dependent variable. Three predictors were included in the model: Age, years of tertiary education and sex (male / female). A The intercorrelations between the variables are given in Table 1, and the regression statistics are given in Table 2. Table 1 Table 2 Intercorrelations Among the Variables Results of Regression for workers, with income as the DV Years Squared part Partial Stand. Regression Income Age T.Edu Variable correlations Correlations coefficients Age 43" Age 094 149 105 Years T.Edu .77" 44" Years T. Edu .651 .720 1725** * Sex -.06 .04 -.02 Sex -.038 -.060 -.038 Note: " p <.05 n="150" r2=".607**" sex coded as female note: p .01 femalecorrelations years of tertiary income age education pearson correlation .426 .772 .440 sig. .000 .243 .297 .400 standardized unstandardized coefficients correlations model b std. error beta t zero-order partial part .105 .071 .149 a. dependent variable:>

Step by Step Solution

There are 3 Steps involved in it

Step: 1

blur-text-image

Get Instant Access to Expert-Tailored Solutions

See step-by-step solutions with expert insights and AI powered tools for academic success

Step: 2

blur-text-image

Step: 3

blur-text-image

Ace Your Homework with AI

Get the answers you need in no time with our AI-driven, step-by-step assistance

Get Started

Recommended Textbook for

Precalculus Enhanced With Graphing Utilities (Subscription)

Authors: Michael, Michael Sullivan III, Michael III Sullivan, III Sullivan

6th Edition

0321849108, 9780321849106

More Books

Students also viewed these Mathematics questions

Question

Different formulas for mathematical core areas.

Answered: 1 week ago