Hi there! I have a project in business accounting class about Ford company
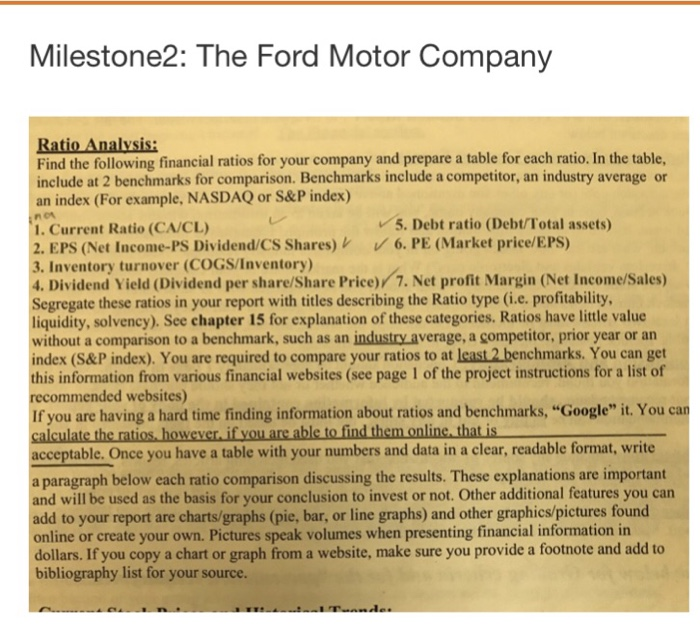
Milestone2: The Ford Motor Company Find the following financial ratios for your company and prepare a table for each ratio. In the table, include at 2 benchmarks for comparison. Benchmarks include a competitor, an industry average or an index (For example, NASDAQ or S&P index) 5. Debt ratio (Debt/Total assets) 1. Current Ratio (CA/CL) 2. EPS (Net Income-PS Dividend/CS Shares)6. PE (Market price/EPS) 3. Inventory turnover (COGS/Inventory 4. Dividend Yield (Dividend per share/Share Price) 7. Net profit Margin (Net Income/Sales) Segregate these ratios in your report with titles describing the Ratio type (i.e. profitability liquidity, solvency). See chapter 15 for explanation of these categories. Ratios have little value without a comparison to a benchmark, such as an industry average, a competitor, prior year or an index (S&P index). You are required to compare your ratios to at least 2 benchmarks. You can get this information from various financial websites (see page 1 of the project instructions for a list of ecommended websites If you are having a hard time finding information about ratios and benchmarks, "Google" it. You can calculate the ratios,however if you are able to find them online, that is acceptable. Once you have a table with your numbers and data in a clear, readable format, write a paragraph below each ratio comparison discussing the results. These explanations are important and will be used as the basis for your conclusion to invest or not. Other additional features you can add to your report are charts/graphs (pie, bar, or line graphs) and other graphics/pictures found online or create your own. Pictures speak volumes when presenting financial information in dollars. If you copy a chart or graph from a website, make sure you provide a footnote and add to bibliography list for your source