Answered step by step
Verified Expert Solution
Link Copied!

Question

1 Approved Answer

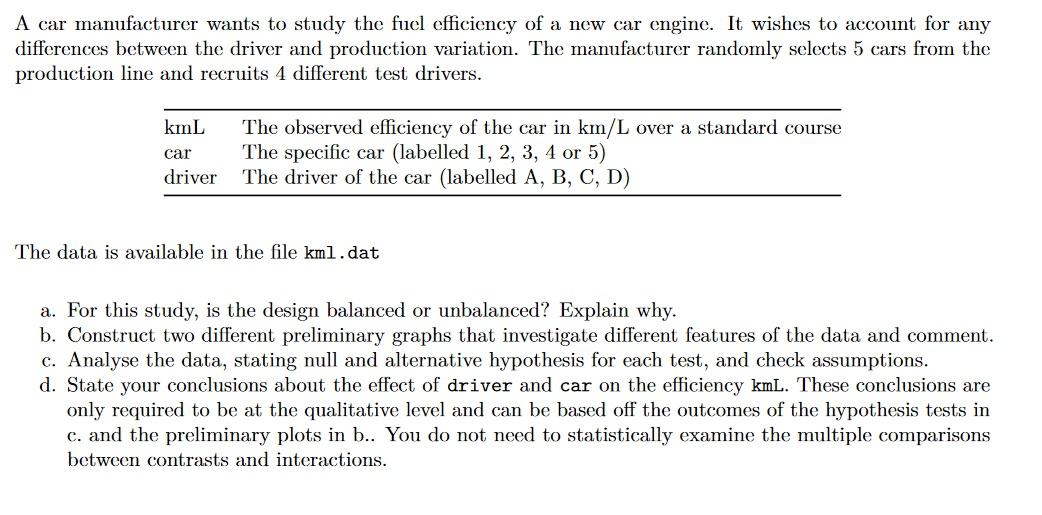
Hi there! I have attached a photo of the questions and the data set as a table and also in word form. Could i please

Hi there!

I have attached a photo of the questions and the data set as a table and also in word form.

Could i please have help with question a and b
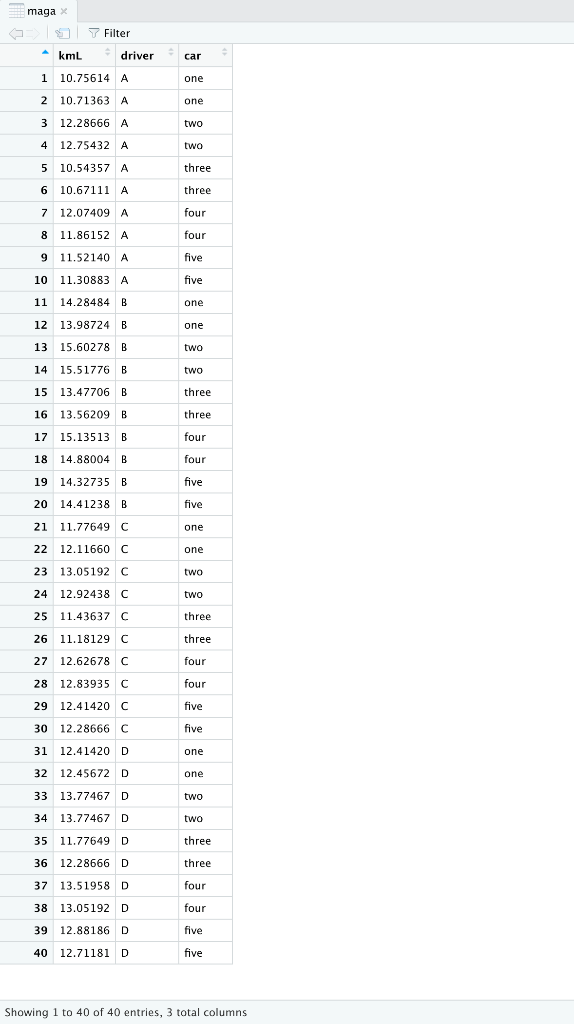
image text in transcribedimage text in transcribed
maga x T Filter kmL * driver car 1 10.75614 A one 2 10.71363 A one 3 12.28666 A two 4 12.75432 A two 5 10.54357 A three 510.67111 A three 7 12.07409 A four 8 11.86152 A four 9 11.52140 A five 10 11.30883 A five 11 14.28484 B one 12 13.98724 B one 13 15.60278 B two 14 15.51776 B two 15 13.47706 B three 16 13.56209 B three 17 15.13513 B four 18 14.88004 B four 19 14.32735 B five 20 14.41238 B five 21 11.77649 C one 22 12.11660 C one 23 13.05192 C two 1 12.92438 C two 25 11.43637 C three 26 11.18129 C three 27 12.62678 C four 28 12.83935 C four 29 12.41420 C five 30 12.28666 C Five 31 12.41420 D one 32 12.45672 D one 33 13.77467 D two 34 13.77467 D two 35 11.77649 D three 36 12.28666 D three 37 13.51958 D four 38 13.05192 D four 39 12.88186 D Five 40 12.71181 D five Showing 1 to 40 of 40 entries, 3 total columnsA car manufacturer wants to stud).r the fuel efciency of a new car engine. It Wishts to account for any differences between the driver and production variation. The manufacturer randomly selects 5 cars from the production line and recruits 4 diereilt test drivers. kmL The observed efciency of the car in km/ L over a standard course car The specic car (labelled 1, 2.1 3, 4 or 5) driver The driver of the car (labelled A, B, C, D) The data is available in the le kml.dat For this study, is the design balanced or unbalanced? Explain why. Construct two different. preliminary graphs that investigate dierent features of the data and comment. Analyse the data, stating null and alternative hypothesis for each test, and check assumptions. State your conclusions about the effect of driver and car on the efciency kmL. These conclusions are only required to be at the qualitative level and can be based off the outcomes of the hypothesis tests in c. and the preliminary plots in b.. You do not need to statistically examine the multiple comparisons between contrasts and interactions. P'FP'P

Step by Step Solution

There are 3 Steps involved in it

Step: 1

blur-text-image

Get Instant Access to Expert-Tailored Solutions

See step-by-step solutions with expert insights and AI powered tools for academic success

Step: 2

blur-text-image

Step: 3

blur-text-image

Ace Your Homework with AI

Get the answers you need in no time with our AI-driven, step-by-step assistance

Get Started

Recommended Textbook for

Applied Calculus

Authors: Stefan Waner, Steven Costenoble

6th Edition

1285415310, 9781285415314

More Books

Students also viewed these Mathematics questions

Question

What is the purpose of an unadjusted trial balance?

Answered: 1 week ago

Question

Give an overview of GIOBUS GT3 Programming model.

Answered: 1 week ago

Question

1. What is meant by Latitudes? 2. What is cartography ?

Answered: 1 week ago

Question

What is order of reaction? Explain with example?

Answered: 1 week ago