Hi there, please can you assist with answering the following statistical questions that have been provided in the images attached. Thank you
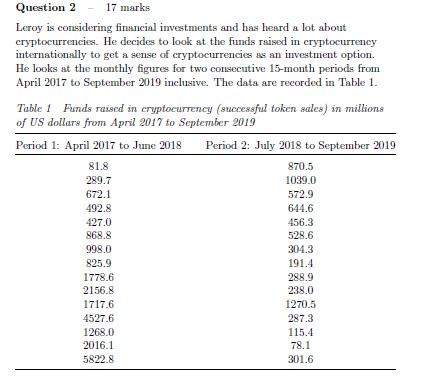
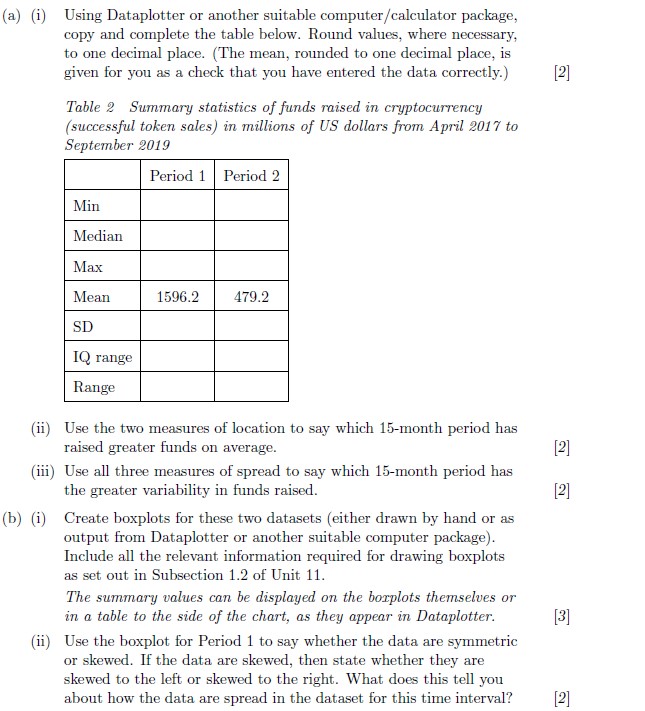
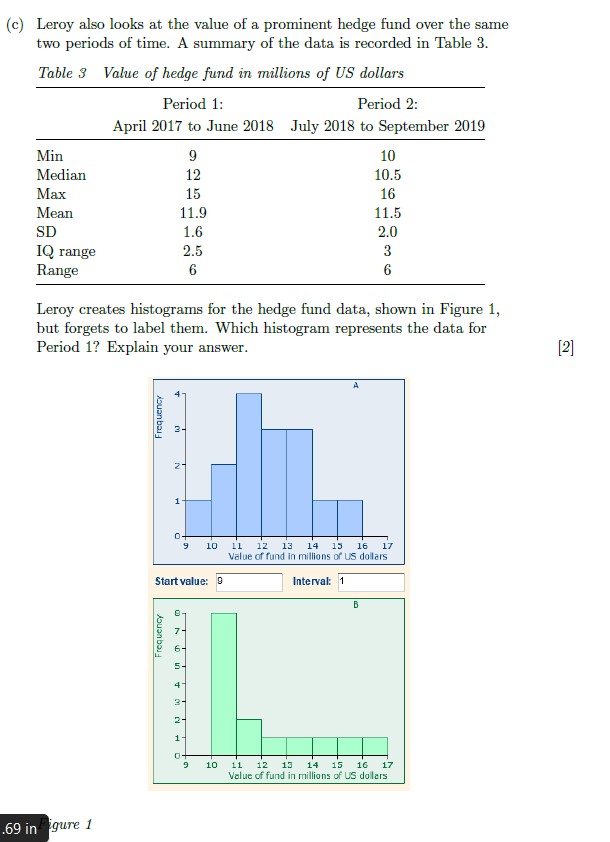
Question 2 - 17 marks Leroy is considering financial investments and has heard a lot about cryptocurrencies. He decides to look at the funds raised in cryptocurrency internationally to get a sense of cryptocurrencies as an investment option. He looks at the monthly figures for two consecutive 15-month periods from April 2017 to September 2019 inclusive. The data are recorded in Table 1. Table 1 Funds raised in cryptocurrency (successful token sales) in millions of US dollars from April 2017 to September 2019 Period 1: April 2017 to June 2018 Period 2: July 2018 to September 2019 81.8 870.5 289.7 1039.0 672.1 572.9 492.8 644.6 427.0 456.3 868.8 528.6 998.0 304.3 825.9 191.4 1778.6 298.9 2156.8 238.0 1717.6 1270.5 4527.6 287.3 1268.0 115.4 2016.1 78.1 5822.8 301.6{a} (1) (ii) {iii} {'3} [1} Using Dataplotter or another suitable computer/calculator package, copy and complete the table below. Round values, where necessary, to one decimal place. (The mean, rounded to one decimal place, is given for you as a check that you have entered the data correctly.) Tobie 2 Summary statistics afrm-15 raised in cryptocunency (sumsful token sales} in millions of US dollars from April 201 T to September 2-1319 Period 1 Period 2 Min Median Max Mean 1596.2 479.2 SD IQ range Range Use the two measures of location to say which 15-month period has raised greater funds on average. Use all three measures of spread to sa},r which 15month period has the greater variability in funds raised. Create boxplots for these two datasets [either drawn by hand or as output from Dataplotter or another suitable computer package]. Include all the relevant information required for drawing boxplots as set out in Subsection 1.? of Unit 11. The summary mines can be dispiayed on the borplots themselves or in. a table to the side of the short, as they appear in Dataplotter. Use the boxplot or Period 1 to sag,r whether the data are symmetric or skewed. If the data are skewed, then state Whether they are skewed to the left or skewed to the right. TWhat does this tell you about how the data are spread in the dataset for this time interval? [9] [9] __-_. __-_. .__ __._ __ r-- ._ .__ ______ -__ __ __-_- _____._. (iii) Leroy tries to sumnlarise what the baxplot for Period 1 is telling him. Are the following statements true or false? In each case justify your answer. [1} In about threequarters of the months, less than $20161 million was raised. [2} There were more months where at least $993 million was raised than months where less than this was raised. L_ J [2] (c) Leroy also looks at the value of a prominent hedge fund over the same two periods of time. A summary of the data is recorded in Table 3. Table 3 Value of hedge fund in millions of US dollars Period 1: Period 2: April 2017 to June 2018 July 2018 to September 2019 Min 9 10 Median 12 10.5 Max 15 16 Mean 11.9 11.5 SD 1.6 2.0 IQ range 2.5 3 Range 6 Leroy creates histograms for the hedge fund data, shown in Figure 1, but forgets to label them. Which histogram represents the data for Period 1? Explain your answer. [2] Frequency 2 - 1 9 10 11 12 13 14 15 16 Value of fund in millions of US dollars 17 Start value: 9 Interval: 1 Frequency 3 - 10 11 12 13 14 15 16 Value of fund in millions of US dollars 69 in gure 1


