

Question
Hi there, Really need step by step help with this one please - Thanks in advance! :) Follow these steps: Follow the instructions in this
Hi there, Really need step by step help with this one please - Thanks in advance! :)
Follow these steps: Follow the instructions in this task to install Jupyter Notebook. In your command line interface, change directory (cd) to the Dropbox folder that contains this task. --> ** (How do I do this? ) Open Jupyter notebook by typing: jupyter notebook Within this task folder, you will find a Jupyter Notebook named Data Sources.ipynb. You can open it by going to Jupyters home screen and double-clicking on the notebook. The notebook will contain the rest of the content for this Task.
1) My Task to complete is below- Please assist me with code & explanation - Thank you kindly :)
2) In your command line interface, change directory (cd) to the Dropbox folder that contains this task. --> How do I do this? ? Please show me a screenshot
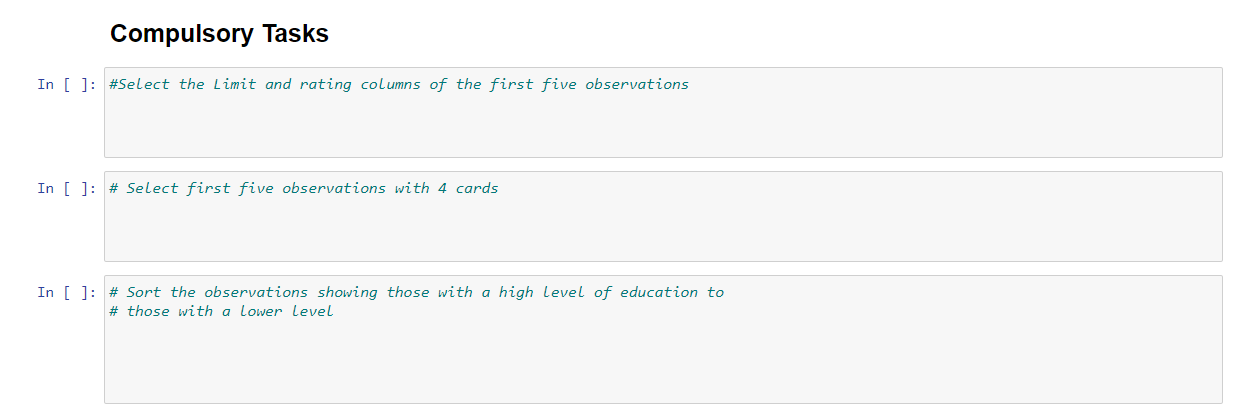
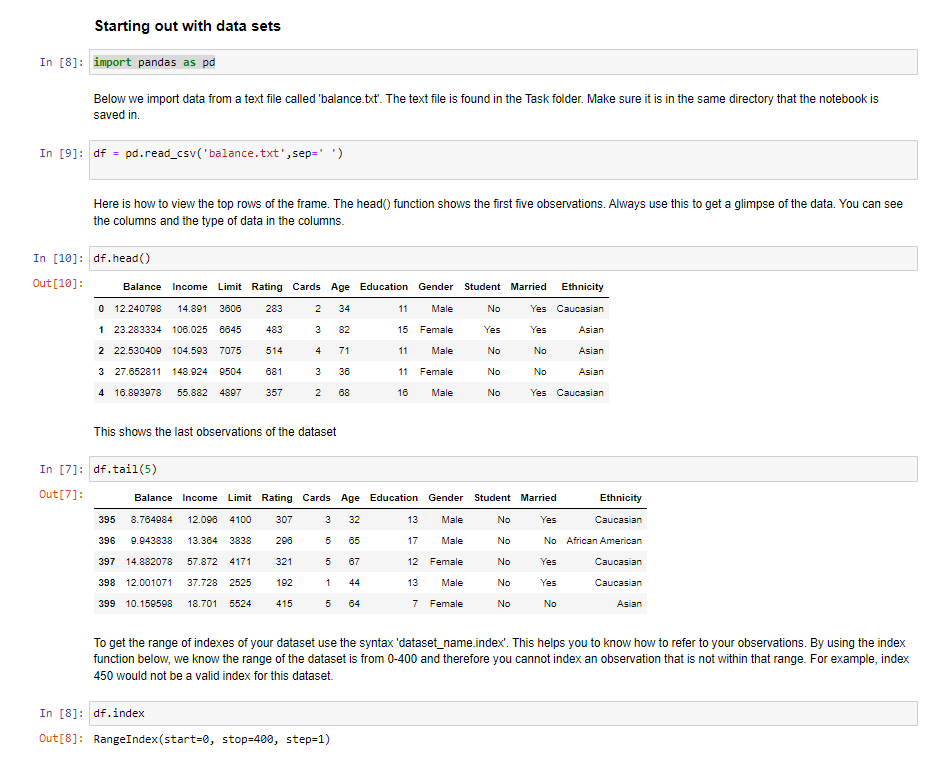
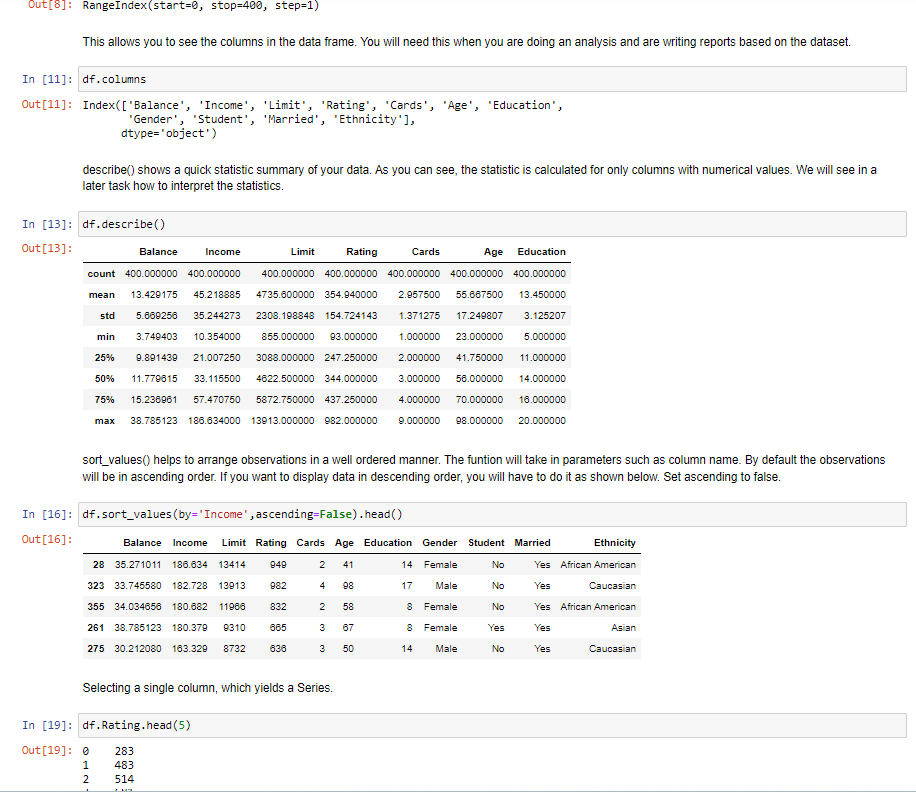
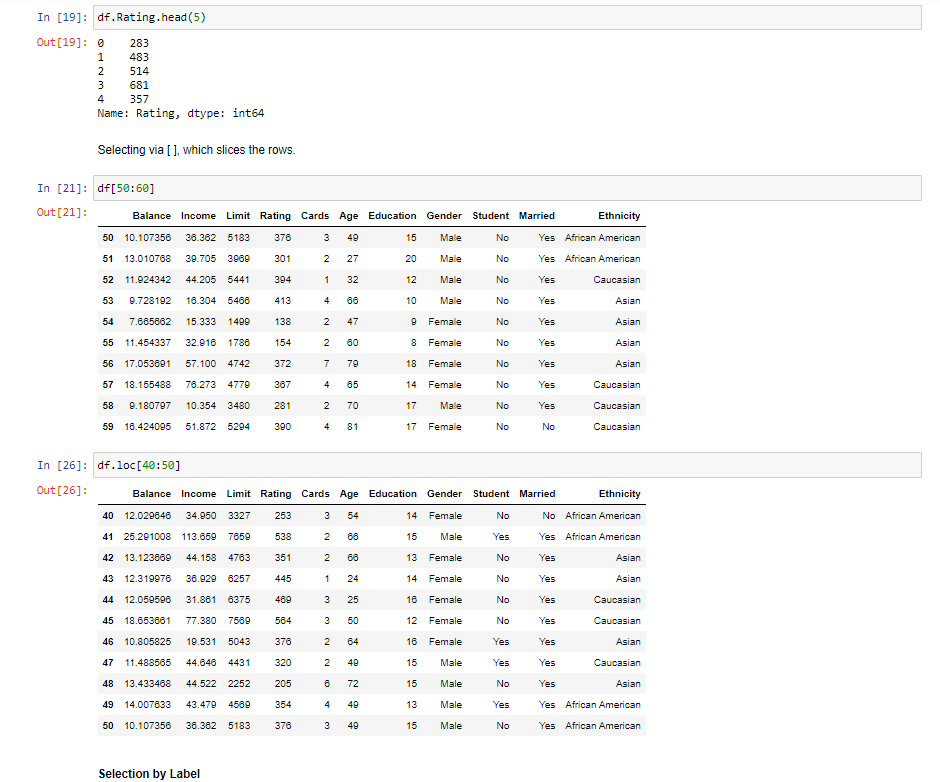
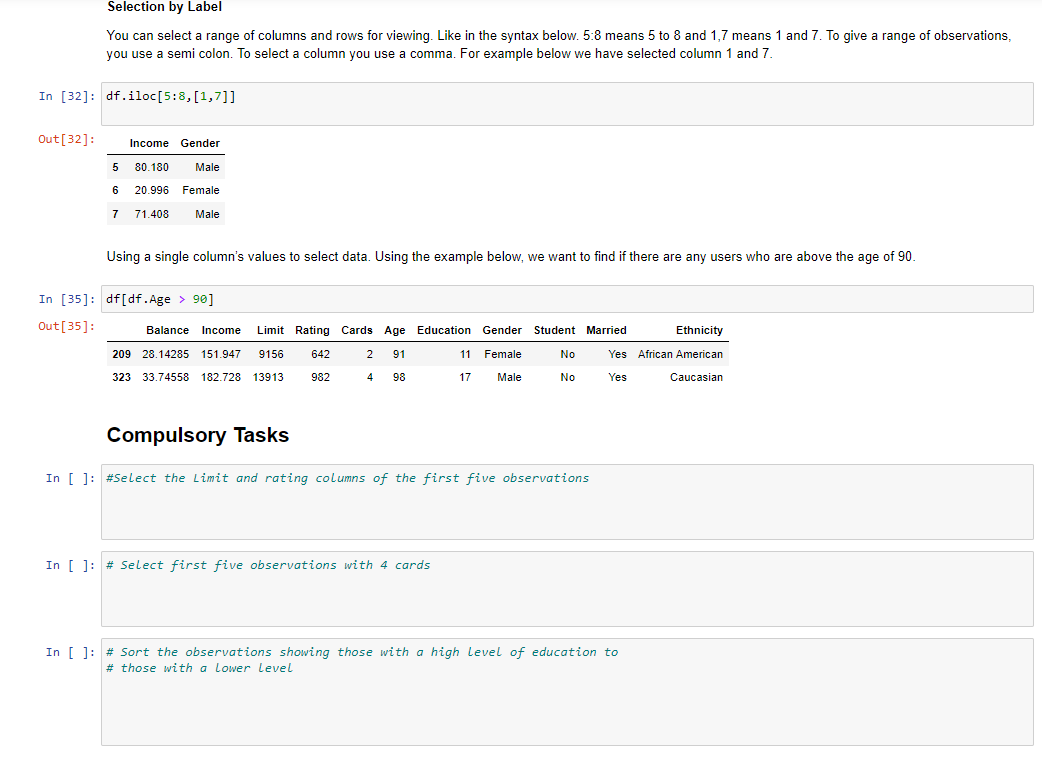
Below we import data from a text file called 'balance.txt'. The text file is found in the Task folder. Make sure it is in the same directory that the notebook is saved in. 9]: df = pd.read_csv('balance.txt',sep=' ') Here is how to view the top rows of the frame. The head() function shows the first five observations. Always use this to get a glimpse of the data. You can see the columns and the type of data in the columns. 0]: df.head() 0]: This shows the last observations of the dataset 7]: df.tail(5) 7]: To get the range of indexes of your dataset use the syntax 'dataset_name.index'. This helps you to know how to refer to your observations. By using the index function below, we know the range of the dataset is from 0400 and therefore you cannot index an observation that is not within that range. For example, index 450 would not be a valid index for this dataset. Out[8]: RangeIndex(start=0, stop =400, step=1) This allows you to see the columns in the data frame. You will need this when you are doing an analysis and are writing reports based on the dataset. In [11]: df.columns Out[11]: Index(['Balance', 'Income', 'Limit', 'Rating', 'Cards', 'Age', 'Education', 'Gender', 'Student', 'Married', 'Ethnicity'], dtype= 'object') describe() shows a quick statistic summary of your data. As you can see, the statistic is calculated for only columns with numerical values. We will see in a later task how to interpret the statistics. In [13]: df.describe() Out [13]: sort_values() helps to arrange observations in a well ordered manner. The funtion will take in parameters such as column name. By default the observations will be in ascending order. If you want to display data in descending order, you will have to do it as shown below. Set ascending to false. In [16]: df.sort_values (by= 'Income ', ascending=False). head () Out [16] : Selecting a single column, which yields a Series. Selecting via [], which slices the rows. In [21]: df[50:60] In [26]: df.10c 40:50] Selection by Label You can select a range of columns and rows for viewing. Like in the syntax below. 5:8 means 5 to 8 and 1,7 means 1 and 7 . To give a range of observations, you use a semi colon. To select a column you use a comma. For example below we have selected column 1 and 7. df.iloc[5:8,[1,7]] Using a single column's values to select data. Using the example below, we want to find if there are any users who are above the age of 90 . Compulsory Tasks Compulsory Tasks In [ ]: \#Select the Limit and rating columns of the first five observations In [ ]: \# Select first five observations with 4 cards In [ ]: \# Sort the observations showing those with a high level of education to \# those with a lower level
Step by Step Solution
There are 3 Steps involved in it
Step: 1

Get Instant Access to Expert-Tailored Solutions
See step-by-step solutions with expert insights and AI powered tools for academic success
Step: 2

Step: 3
Ace Your Homework with AI
Get the answers you need in no time with our AI-driven, step-by-step assistance
Get Started
Intelligent Databases Object Oriented Deductive Hypermedia Technologies
Authors: Kamran Parsaye, Mark Chignell, Setrag Khoshafian, Harry Wong
1st Edition
0471503452, 978-0471503453