Hi Tutor, I am trying to prepare a scatter plot through Jupyterlab but it is not successful. Please see print short and offer instructions.
I tried to remove the arguments but it is not working either. In the future, how can I copy and paste such codes in notepad or word documents?
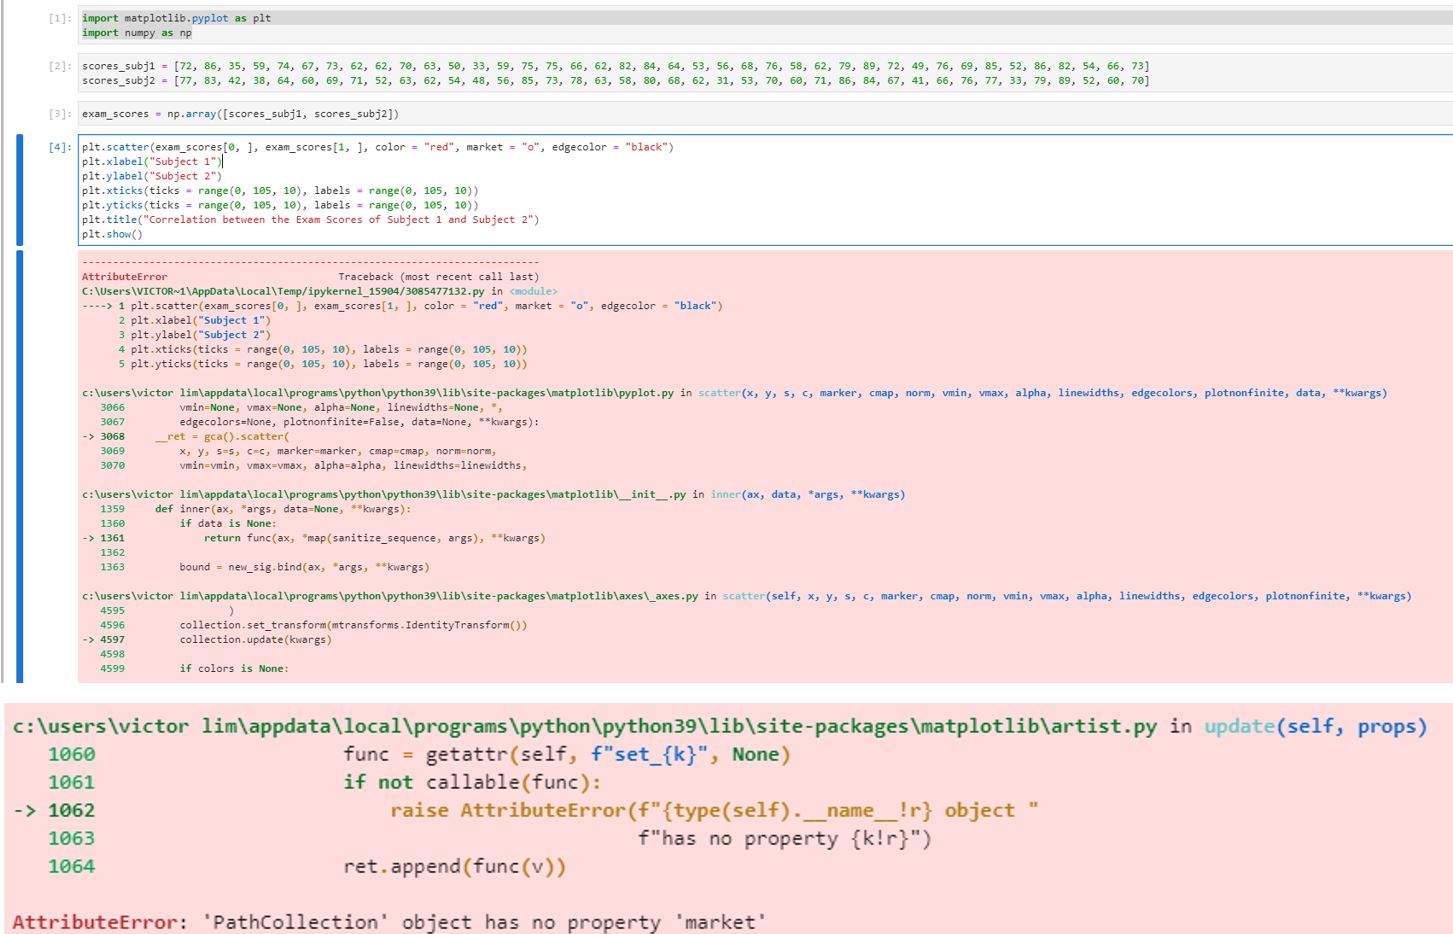
[1]: import matplotlib. pyplot as pit import numpy as np [2]: scores_subji = [72, 86, 35, 59, 74, 67, 73, 62, 62, 70, 63, 50, 33, 59, 75, 75, 66, 62, 82, 84, 64, 53, 56, 68, 76, 58, 62, 79, 89, 72, 49, 76, 69, 85, 52, 86, 82, 54, 66, 73] scores_subj2 = [77, 83, 42, 38, 64, 60, 69, 71, 52, 63, 62, 54, 48, 56, 85, 73, 78, 63, 58, 80, 68, 62, 31, 53, 70, 60, 71, 86, 84, 67, 41, 66, 76, 77, 33, 79, 89, 52, 60, 70] [3]: exam_scores = np.array ([scores_subj1, scores_subj2]) [4]: pit. scatter (exam_scores[0, ], exam_scores[1, ], color = "red", market = "o", edgecolor = "black") plt.xlabel("Subject 1")| pit. ylabel("Subject 2") pit.xticks (ticks = range(0, 105, 10), labels = range(0, 105, 10)) pit.yticks(ticks = range(0, 105, 10), labels = range(0, 105, 10)) pit. title("Correlation between the Exam Scores of Subject 1 and Subject 2") pit. show() AttributeError Traceback (most recent call last) C:\\Users\\VICTOR~1\\AppData\\Local\\Temp/ipykernel_15904/3085477132.py in
-."-> 1 plt. scatter (exam_scores[0, ], exam_scores[1, ], color = "red", market - "o", edgecolor - "black") 2 plt . xlabel("Subject 1") 3 plt . ylabel("Subject 2") 4 plt. xticks(ticks = range(0, 105, 10), labels = range(0, 105, 10)) 5 plt. yticks (ticks = range(0, 105, 10), labels = range(0, 105, 10)) c:\\users \\victor lim\\appdata\\local\\programs\\python\\python39\\lib\\site-packages\\matplotlib\\pyplot.py in scatter(x, y, s, C, marker, cmap, norm, vmin, vmax, alpha, linewidths, edgecolors, plotnonfinite, data, "*kwargs) 3066 vmin=None, vmax-None, alpha=None, linewidths-None, ", 3067 edgecolors=None, plotnonfinite=False, data=None, *>kwargs): > 3068 ret = gca().scatter( 3069 X, y, 5=5, C=c, marker=marker, cmap=cmap, norm=norm, 3070 vmin=vmin, vmax=vmax, alpha=alpha, linewidths-linewidths, c:\\users\\victor lim\\appdata\\local\\programs\\python\\python39\\lib\\site-packages\\matplotlib\\_init_.py in inner(ax, data, "args, *"kwargs) 1359 def inner (ax, "args, data=None, ">kwargs): 1360 if data is None: -> 1361 return func(ax, "map(sanitize_sequence, args), ""kwargs) 1362 1363 bound = new_sig.bind(ax, "args, "#kwargs) c:\\users\\victor lim\\appdata\\local\\programs\\python\\python39\\lib\\site-packages\\matplotlib\\axes\\_axes.py in scatter(self, x, y, S, C, marker, cmap, norm, vmin, vmax, alpha, linewidths, edgecolors, plotnonfinite, ">kwargs) 4595 4596 collection. set_transform(mtransforms . IdentityTransform()) >4597 collection. update(kwargs) 4598 4599 if colors is None: c: \\users\\victor lim\\appdata\\local\\programs \\python\\python39\\lib\\site-packages\\matplotlib\\artist.py in update(self, props) 1060 func = getattr(self, f"set_{k)", None) 1061 if not callable(func) : -> 1062 raise AttributeError (f" {type(self)._name_!r} object " 1063 f"has no property {kir}") 1064 ret . append (func(v)) AttributeError: 'PathCollection' object has no property 'market"