Question
Hierarchical Clustering (Python Implementation) A problem with k-means clustering is that we may not know what k is (though we could try several and compare
Hierarchical Clustering (Python Implementation)
A problem with k-means clustering is that we may not know what k is (though we could try several and compare the resulting cluster quality). Another way to cluster, avoiding such a parameter (but with its own issues), is called hierarchical clustering. A hierarchical clustering is a binary tree, with higher-up branches connecting subtrees that are less similar, and lower-down branches connecting subtrees that are more similar.
For example, consider the following data (https://raw.githubusercontent.com/gsprint23/cpts215/master/progassignments/files/simple.csv):
| Sample | ||||||||||
|---|---|---|---|---|---|---|---|---|---|---|
| g0 | 0 | 0.1 | 0.2 | 0 | 0.4 | 0.5 | 0.6 | 0.7 | 0.8 | 0.9 |
| g1 | 1.0 | 0.9 | 0.8 | 0.7 | 0.6 | 0.5 | 0.4 | 0.3 | 0 | 0.1 |
| g2 | 0.1 | 0.2 | 0.3 | 0.4 | 0.5 | 0.6 | 0.7 | 0.8 | 0.9 | 1.0 |
| g3 | 0.4 | 0.4 | 0.4 | 0.4 | 0.4 | 0.4 | 0.4 | 0.4 | 0.4 | 0.4 |
| g4 | 0.9 | 0.8 | 0.7 | 0.6 | 0.5 | 0.4 | 0.3 | 0.2 | 0.1 | 0.0 |
| g5 | 0.5 | 0 | 0.5 | 0.5 | 0.5 | 0.5 | 0.5 | 0.5 | 0.5 | 0.5 |
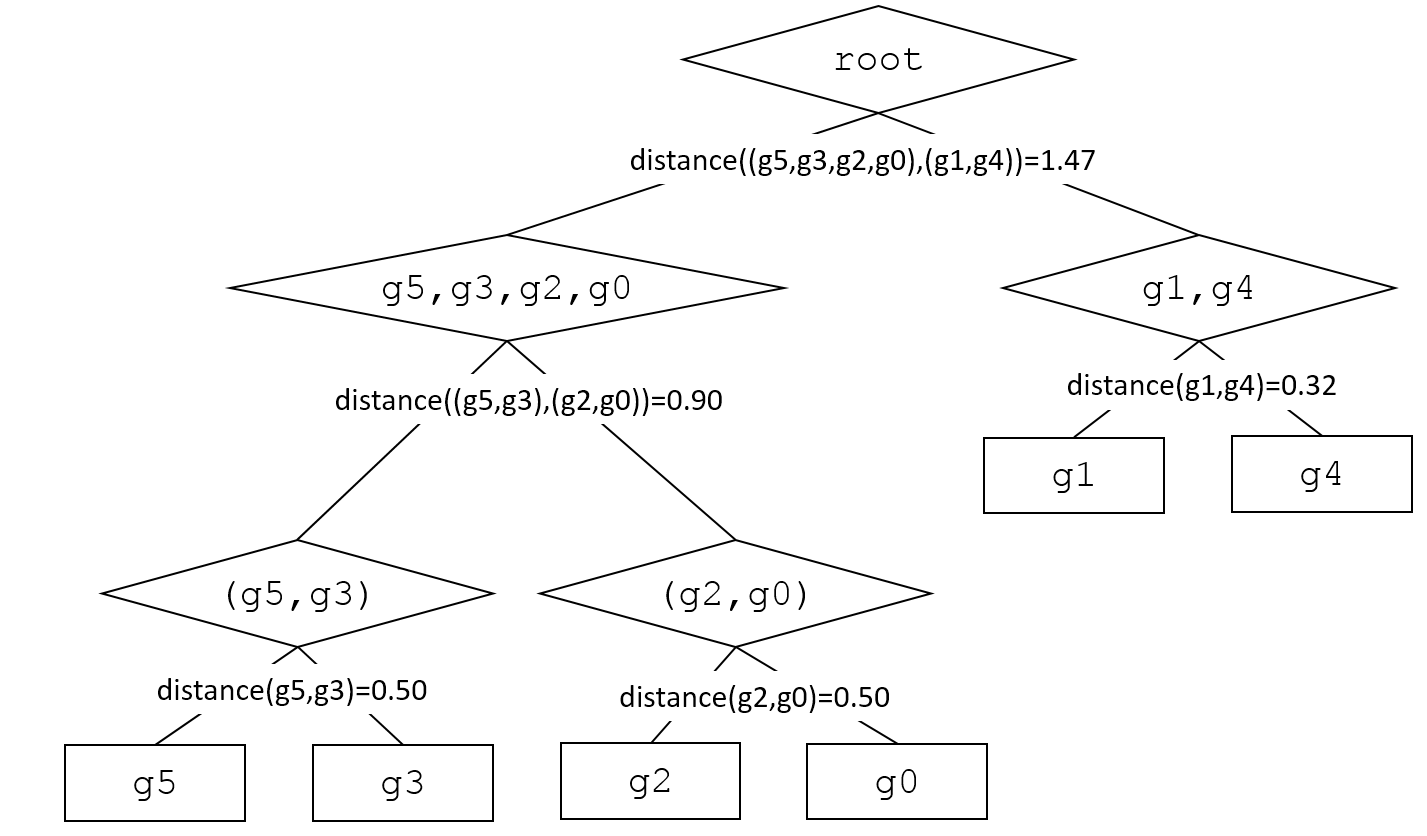
One possible hierarchical clustering for this simple example is as follows (a string representation of the binary tree with "*" as the label for the inner nodes):
g1 * g4 * g0 * g2 * g3 * g5
Graphically:
The simple made-up case for initial testing is ( https://raw.githubusercontent.com/gsprint23/cpts215/master/progassignments/files/simple.csv); the real dataset is (https://raw.githubusercontent.com/gsprint23/cpts215/master/progassignments/files/cancer.csv.)
Hierarchical clustering builds a tree bottom up. Each object starts in its own cluster (a leaf node, denoted with a square in the above diagram). We then find the closest pair of clusters, and make them the children of a newly formed cluster (inner node, denoted with a diamond in the above diagram). That cluster is then treated like the rest of the clusters (leaves and inner nodes). We repeat the process:
Find the closest pair of clusters (which could be leaves or inner nodes)
Make them children of a new cluster (inner node)
Repeat until all that's left is a single object (the root)
When we form a cluster, we need to be able to compute its distance to the other clusters (leaves and inner nodes), so that we can determine which pair is closest. Distances involving one or two clusters can be computed in a number of ways. For this assignment we will simply use the centroid of a cluster as a representative point for computing the cluster's distance. We define the centroid of a cluster to be the weighted average of the centroids of all leaves in the subtree.
Implementation
We need to keep track of two things: the clusters that need to be further clustered (starting with the leaves), and the distances between them.
Classes to Define
Pair: keeps track of distances between a pair of clusters
Includes a __lt__() for comparing Pair objects for heap ordering purposes
Computes the weighted centroid of cluster pair. This can be done by weighting the average of the centroids of the two clusters by the number of leaves.
HierarchicalCluster: a binary tree representing the hierarchical clusters
Inherits from BinaryTree
root_data is the weighted centroid of the tree
BinaryMinHeap: a priority queue used to find the closest pair of clusters
Utilizes Pair's __lt__(), that enables us to find the closest pair of clusters, which is the next to merge in the hierarchical clustering
Algorithm
Initialize the priority queue (BinaryMinHeap) with all pairs (Pair) of trees. Then when a new cluster is formed, create new pairs between it and the remaining clusters (not its children!) and add them to the queue. Be careful not to merge a cluster twice. An easy way to do this is to test, after removing the closests pair from the priority queue, whether its left and right trees are both still available. That's one reason why as mentioned above we keep track of the clusters that haven't yet been clustered. So be sure to update that list appropriately upon merging. Loop until there's only 1 thing left in the queue the single cluster that's the whole tree (root node).
Observations
Test on the two provided datasets, along with any others you like. Note that in addition to the visual display (heatmaps), the tree structure and k-means cluster memberships are printed to the console; paste into a text editor to see everything. (The visual display doesn't capture the tree structure, but does reorder the leaves along the fringe, so you can kind of see patterns of similarity.) Save the textual representations and take screenshots.
Write a short (at least a couple paragraphs) description of what you observe in the clusters, e.g. similarities and differences between the two methods and their strengths and weaknesses. Also discuss how well the clustering captures the similarities and differences in the samples (e.g. are same-type cancers clustered?).
Bonus (5 pts)
Do a divisive clusters rather than an agglomerative one; i.e., build the tree from root to leaves, by splitting rather than merging.
root distance((g5,g3,g2,g0),(g1,g4))-1.47 g5,g3, g2,g0 g1,g4 distance(g1,g4)-0.32 distance((g5,g3), (g2,g0)) 0.90 g1 g4 (g5, g3) (g2,g0) distance(g5,g3)-0.50 distance(g2,g0)-0.50 g5 g3 g2 root distance((g5,g3,g2,g0),(g1,g4))-1.47 g5,g3, g2,g0 g1,g4 distance(g1,g4)-0.32 distance((g5,g3), (g2,g0)) 0.90 g1 g4 (g5, g3) (g2,g0) distance(g5,g3)-0.50 distance(g2,g0)-0.50 g5 g3 g2Step by Step Solution
There are 3 Steps involved in it
Step: 1

Get Instant Access to Expert-Tailored Solutions
See step-by-step solutions with expert insights and AI powered tools for academic success
Step: 2

Step: 3

Ace Your Homework with AI
Get the answers you need in no time with our AI-driven, step-by-step assistance
Get Started


