Hint: for the portoflio standard deviation, start by creating a table like the one in Section 3.1 for the N-asset case. In fact, begin by creating a table with the products of the weights and standard deviations for each pair of stocks. If you are careful about how you construct the formulas, you can copy them. Then take the results from this intermediate table and multiply them by the correlations above.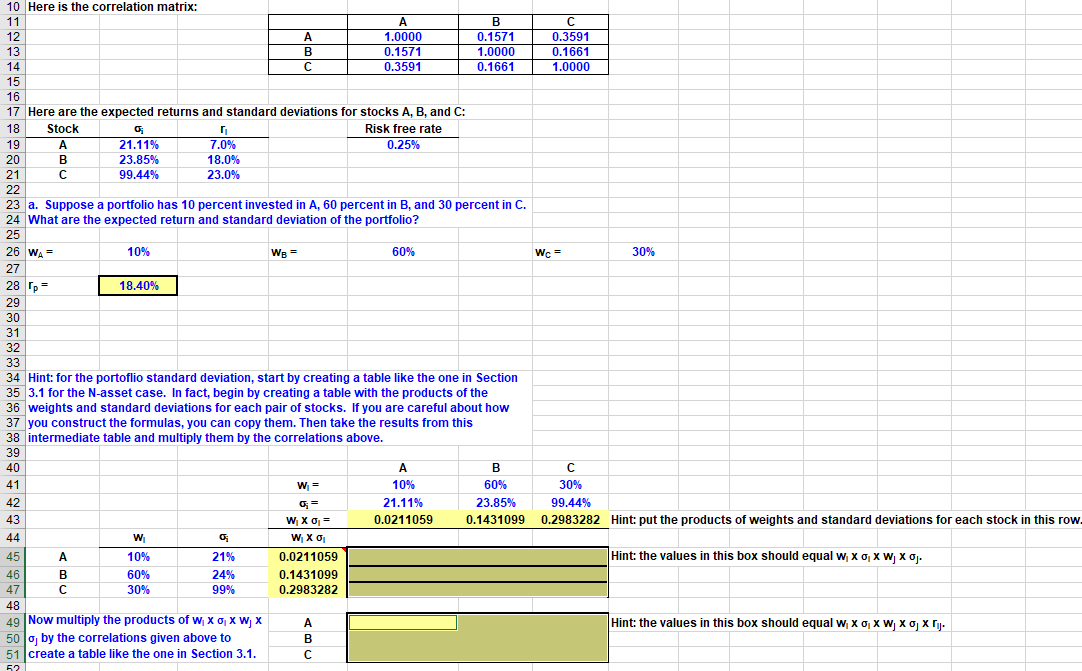 Please help with highlighted cells (E45:G47 and E49:G51)
10 Here is the correlation matrix: 12 13 14 1.0000 0.1571 0.3591 0.1571 1.0000 0.1661 0.3591 0.1661 1.0000 15 16 17 Here are the expected returns and standard deviations for stocks A, B, and C: 18 Stock Risk free rate 21.11% 7.0% 0.25% 23.85% 18.0% 21 99.44% 23.0% 20 23 a. Suppose a portfolio has 10 percent invested in A, 60 percent in B, and 30 percent in C. 24 What are the expected return and standard deviation of the portfolio? WA= 10% 60% W = 30% 18.40% 33 34 Hint: for the portoflio standard deviation, start by creating a table like the one in Section 35 3.1 for the N-asset case. In fact, begin by creating a table with the products of the 36 weights and standard deviations for each pair of stocks. If you are careful about how 37 you construct the formulas, you can copy them. Then take the results from this 38 intermediate table and multiply them by the correlations above. 39 W = BC 60% 30% 23.85% 99.44% 0.1431099 0.2983282 Hint: put the products of weights and standard deviations for each stock in this row. 10% 21.11% 0.0211059 = W Xo = W XO W Hint: the values in this box should equal w XoXWX0. 10% 60% 21% 24% 99% 0.0211059 0.1431099 0.2983282 30% Hint: the values in this box should equal w X X W X Xj. 49 Now multiply the products of W, X, XW, X 50 g by the correlations given above to 51 create a table like the one in Section 3.1. 10 Here is the correlation matrix: 12 13 14 1.0000 0.1571 0.3591 0.1571 1.0000 0.1661 0.3591 0.1661 1.0000 15 16 17 Here are the expected returns and standard deviations for stocks A, B, and C: 18 Stock Risk free rate 21.11% 7.0% 0.25% 23.85% 18.0% 21 99.44% 23.0% 20 23 a. Suppose a portfolio has 10 percent invested in A, 60 percent in B, and 30 percent in C. 24 What are the expected return and standard deviation of the portfolio? WA= 10% 60% W = 30% 18.40% 33 34 Hint: for the portoflio standard deviation, start by creating a table like the one in Section 35 3.1 for the N-asset case. In fact, begin by creating a table with the products of the 36 weights and standard deviations for each pair of stocks. If you are careful about how 37 you construct the formulas, you can copy them. Then take the results from this 38 intermediate table and multiply them by the correlations above. 39 W = BC 60% 30% 23.85% 99.44% 0.1431099 0.2983282 Hint: put the products of weights and standard deviations for each stock in this row. 10% 21.11% 0.0211059 = W Xo = W XO W Hint: the values in this box should equal w XoXWX0. 10% 60% 21% 24% 99% 0.0211059 0.1431099 0.2983282 30% Hint: the values in this box should equal w X X W X Xj. 49 Now multiply the products of W, X, XW, X 50 g by the correlations given above to 51 create a table like the one in Section 3.1