Answered step by step
Verified Expert Solution
Question
1 Approved Answer
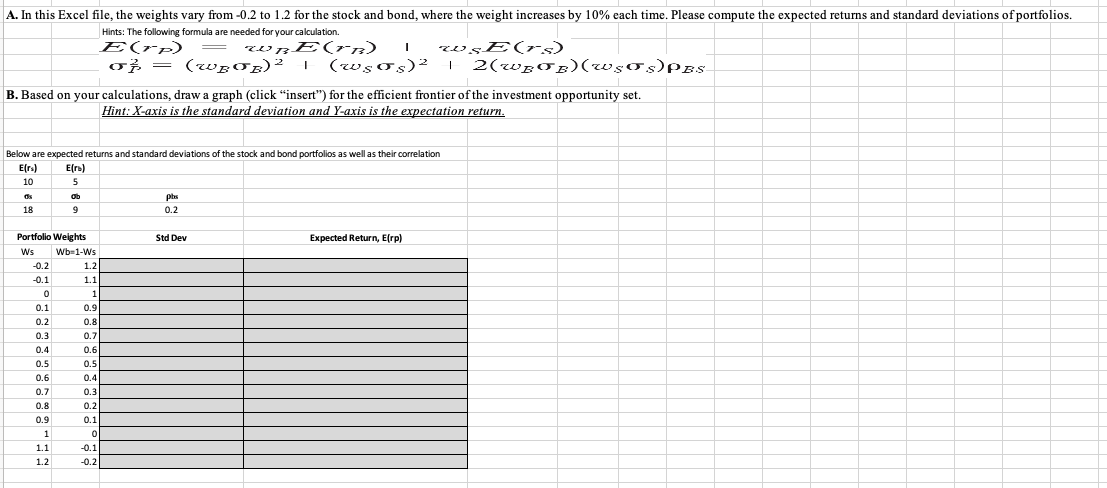
Hints: The following formula are needed for your calculation. B. Based on your calculations, draw a graph (click insert) for the efficient frontier of the
 Hints: The following formula are needed for your calculation. B. Based on your calculations, draw a graph (click "insert") for the efficient frontier of the investment opportunity set. Hint: X-axis is the standard deviation and Y-axis is the expectation return. Below are expected returns and standard deviations of the stock and bond portfolios as well as their correlation
 Step by Step Solution
There are 3 Steps involved in it
Step: 1

Get Instant Access to Expert-Tailored Solutions
See step-by-step solutions with expert insights and AI powered tools for academic success
Step: 2

Step: 3

Ace Your Homework with AI
Get the answers you need in no time with our AI-driven, step-by-step assistance
Get Started


