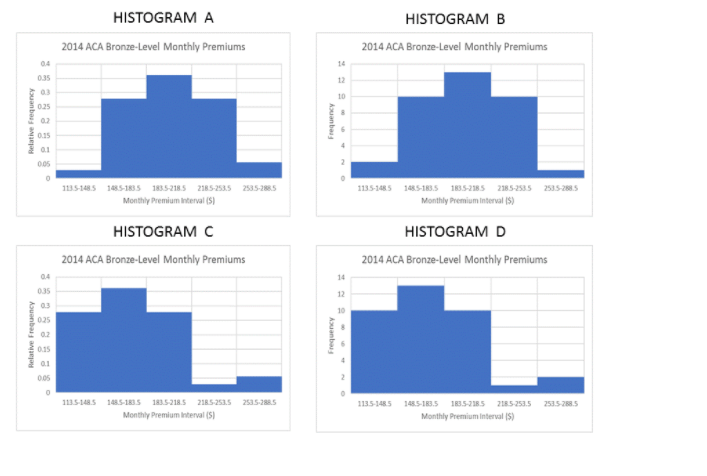
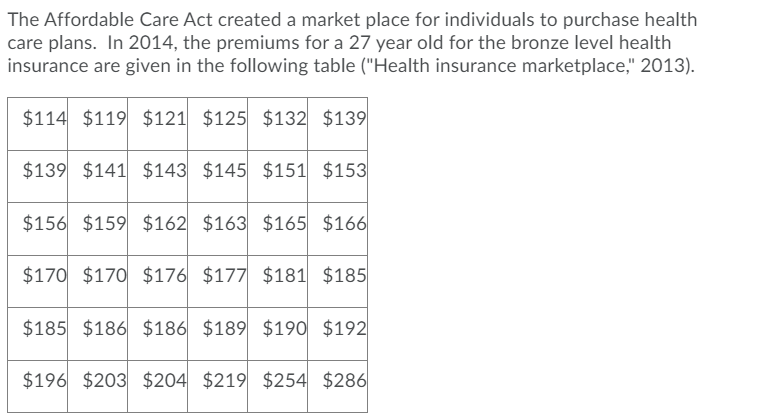
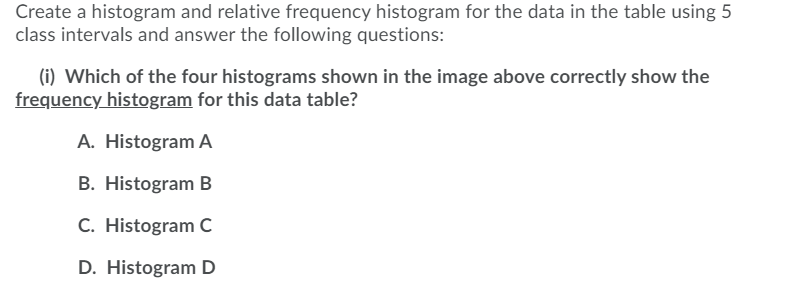
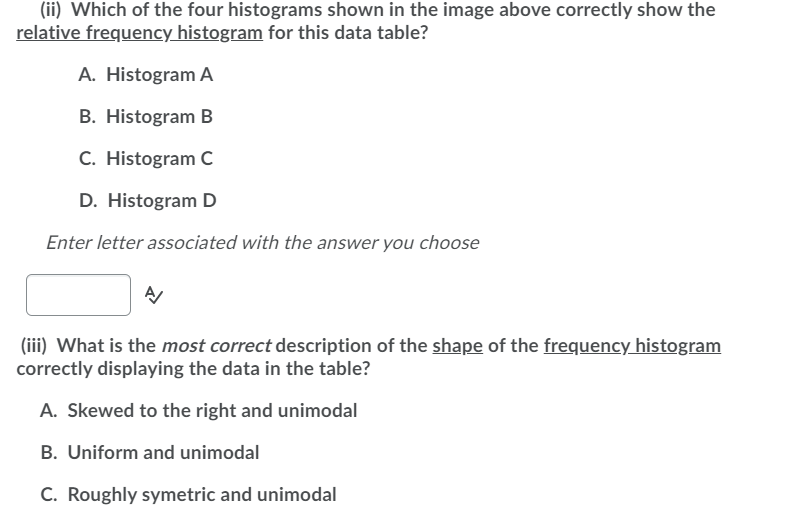
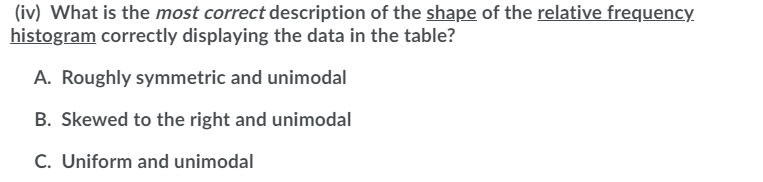
HISTOGRAM A HISTOGRAM B 2014 ACA Bronze-Level Monthly Premiums 2014 ACA Bronze-Level Monthly Premiums 04 14 0.35 0.3 0.25 Frequency Relative Frequency 0.15 0.05 1135-1485 1485-1835 1835-2185 2185-2535 2535-2885 1135-1485 1485-183.5 183.5-2185 2185-2585 2515-2685 Monthly Premium Interval (5) Monthly Premium Interval (5) HISTOGRAM C HISTOGRAM D 2014 ACA Bronze-Level Monthly Premiums 2014 ACA Bronze-Level Monthly Premiums 14 0.35 12 03 10 0.25 Relative Frequency 0.2 Frequency 0.15 0.I 0.05 113.5-148.5 148.5-183.5 183.5-2185 2185-253.5 2535-288.5 1135-1485 1485-183.5 1835-2185 2185-253.5 253.5-368.5 Monthly Premium Interval (5) Monthly Premium Interval ($)The Affordable Care Act created a market place for individuals to purchase health care plans. In 2014, the premiums for a 27 year old for the bronze level health insurance are given in the following table ("Health insurance marketplace," 2013). $114 $119 $121 $125 $132 $139 $139 $141 $143 $145 $151 $153 $156 $159 $162 $163 $165 $166 $170 $170 $176 $177 $181 $185 $185 $186 $186 $189 $190 $192 $196 $203 $204 $219 $254 $286Create a histogram and relative frequency histogram for the data in the table using 5 class intervals and answer the following questions: (i) Which of the four histograms shown in the image above correctly show the frequency histogram for this data table? A. Histogram A B. Histogram B C. Histogram C D. Histogram D(ii) Which of the four histograms shown in the image above correctly show the relative frequency histogram for this data table? A. Histogram A B. Histogram B C. Histogram C D. Histogram D Enter letter associated with the answer you choose A/ (iii) What is the most correct description of the shape of the frequency histogram correctly displaying the data in the table? A. Skewed to the right and unimodal B. Uniform and unimodal C. Roughly symetric and unimodal{iv} What is the most correct description of the 5h_-:-ID_E of the relative frequency: histogm correctly displaying the data in the table? A. Roughly symmetric and unimodal B. Skewed to the right and uni model C. Uniform and unimodal