

Answered step by step
Verified Expert Solution
Question
1 Approved Answer
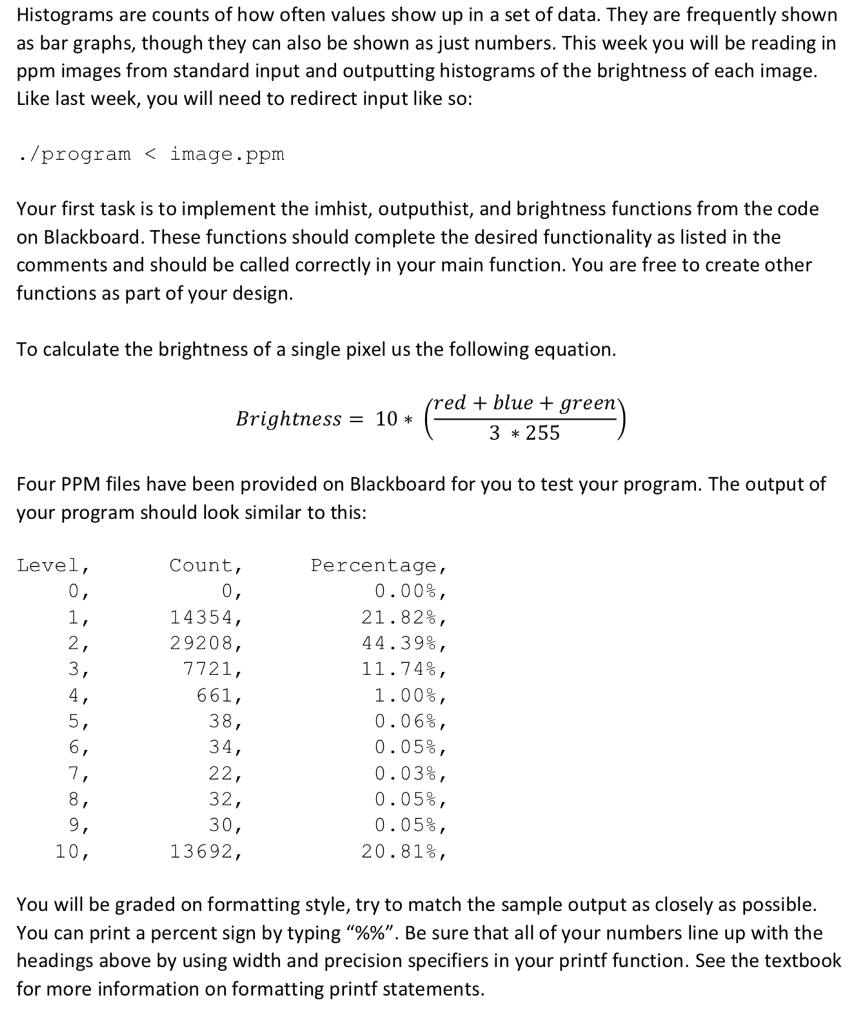
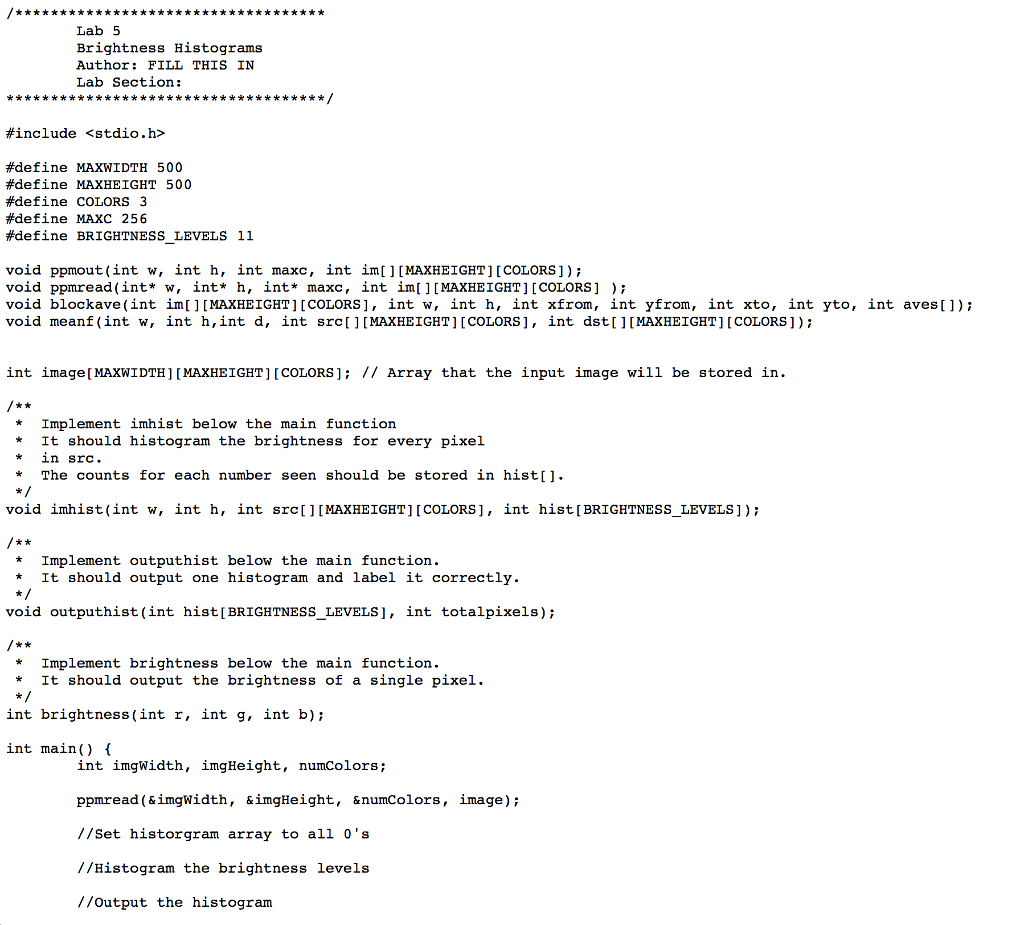
Histograms are counts of how often values show up in a set of data. They are frequently shown as bar graphs, though they can also
Step by Step Solution
There are 3 Steps involved in it
Step: 1

Get Instant Access to Expert-Tailored Solutions
See step-by-step solutions with expert insights and AI powered tools for academic success
Step: 2

Step: 3
Ace Your Homework with AI
Get the answers you need in no time with our AI-driven, step-by-step assistance
Get Started
Making Databases Work The Pragmatic Wisdom Of Michael Stonebraker
Authors: Michael L. Brodie
1st Edition
1947487167, 978-1947487161