Answered step by step
Verified Expert Solution
Question
1 Approved Answer
Historical monthly prices for Tesla and the S&P 500 Index. S&P 500 Tesla Index 1/31/2019 $ 307.02 2,704 2/28/2019 $ 319.88 2,784 3/31/2019 $ 279.86
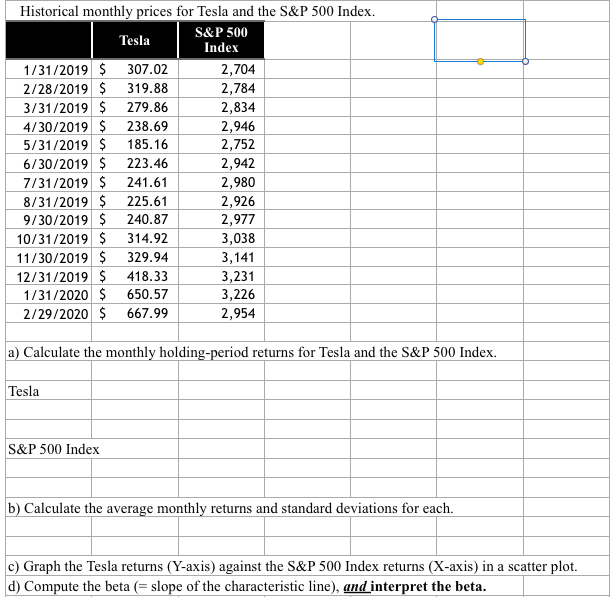
Historical monthly prices for Tesla and the S&P 500 Index. S&P 500 Tesla Index 1/31/2019 $ 307.02 2,704 2/28/2019 $ 319.88 2,784 3/31/2019 $ 279.86 2,834 4/30/2019 $ 238.69 2,946 5/31/2019 $ 185.16 2,752 6/30/2019 $ 223.46 2,942 7/31/2019 $ 241.61 2,980 8/31/2019 $ 225.61 2,926 9/30/2019 $ 240.87 2,977 10/31/2019 $ 314.92 3,038 11/30/2019 $ 329.94 3,141 12/31/2019 $ 418.33 3,231 1/31/2020 $ 650.57 3,226 2/29/2020 $ 667.99 2,954 a) Calculate the monthly holding-period returns for Tesla and the S&P 500 Index. Tesla S&P 500 Index b) Calculate the average monthly returns and standard deviations for each. c) Graph the Tesla returns (Y-axis) against the S&P 500 Index returns (X-axis) in a scatter plot. d) Compute the beta (= slope of the characteristic line), and interpret the beta
Step by Step Solution
There are 3 Steps involved in it
Step: 1
Get Instant Access to Expert-Tailored Solutions
See step-by-step solutions with expert insights and AI powered tools for academic success
Step: 2
Step: 3
Ace Your Homework with AI
Get the answers you need in no time with our AI-driven, step-by-step assistance
Get Started