

Question
Historical Ratios 12/31/16 12/31/17 Current Ratio Quick Ratio Total Debt to Total Assets Ratio Times Interest Earned Ratio
Historical Ratios | ||
| 12/31/16 | 12/31/17 | |
Current Ratio | ||
Quick Ratio | ||
Total Debt to Total Assets Ratio | ||
Times Interest Earned Ratio | ||
Inventory Turnover |
|
|
Fixed Assets Turnover |
|
|
Total Assets Turnover |
|
|
Accounts Receivable Turnover |
|
|
Average Collection Period |
|
|
Gross Profit Margin % |
|
|
Operating Profit Margin % |
|
|
ROA% |
|
|
ROE% |
|
|
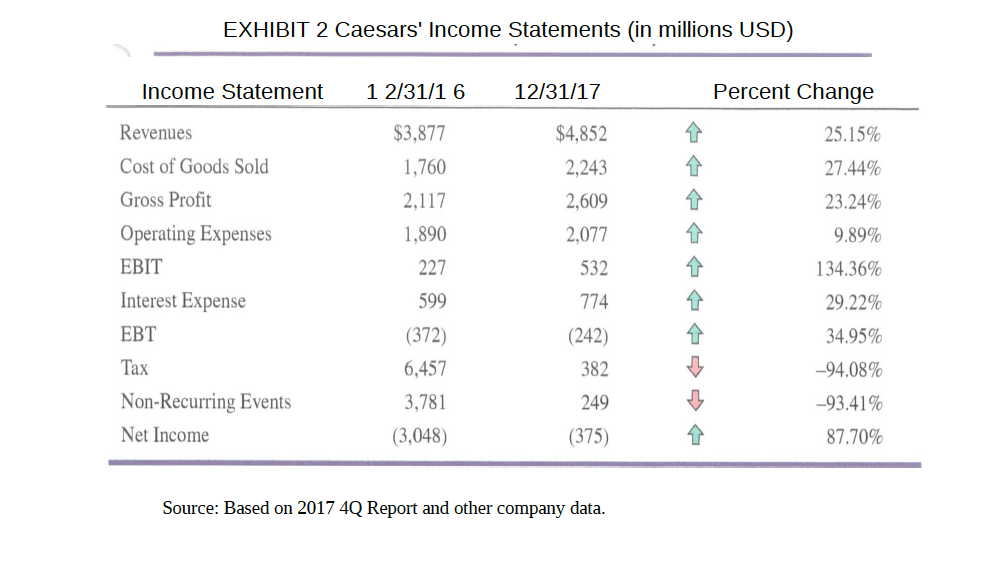
EXHIBIT 2 Caesars' Income Statements (in millions USD) Income Statement 1 2/31/1 6 12/31/17 Percent Change Revenues $3,877 $4,852 25.15% Cost of Goods Sold 1,760 2,243 27.44% Gross Profit 2,117 2,609 23.24% Operating Expenses 1,890 2,077 9.89% EBIT 227 532 134.36% Interest Expense 599 774 29.22% EBT (372) (242) 34.95% Tax 6,457 382 -94.08% Non-Recurring Events 3,781 249 -93.41% Net Income (3,048) (375) 87.70% Source: Based on 2017 4Q Report and other company data.
Step by Step Solution
There are 3 Steps involved in it
Step: 1

Get Instant Access to Expert-Tailored Solutions
See step-by-step solutions with expert insights and AI powered tools for academic success
Step: 2

Step: 3
Ace Your Homework with AI
Get the answers you need in no time with our AI-driven, step-by-step assistance
Get Started
Financial Reporting Financial Statement Analysis and Valuation
Authors: Clyde P. Stickney
6th edition
324302959, 978-0324302967, 324302967, 978-0324302950