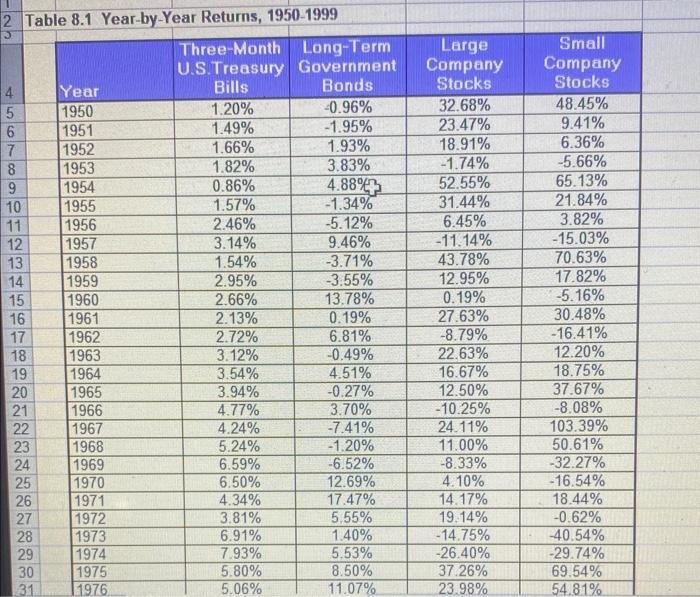
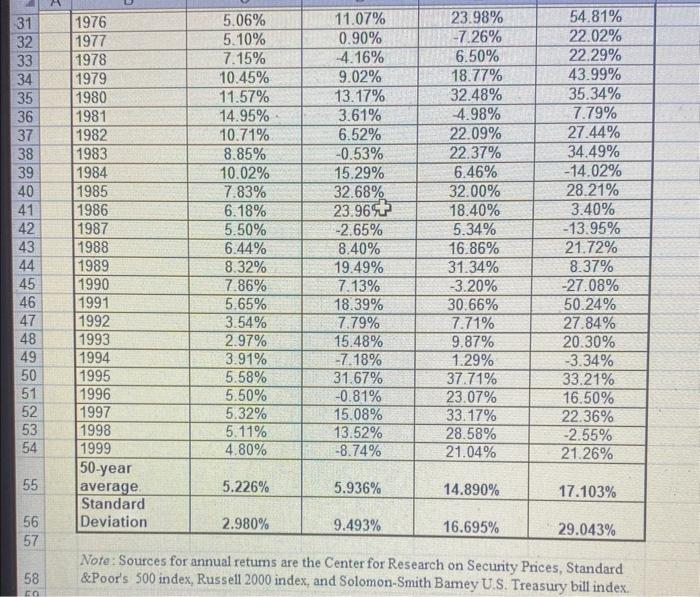
Historical returns. Calculate the arithmetic average retum of U.S. Treasury bills, long-term government bonds, and large-company stocks for 1990 to 1999. Which had the highest retum? Which had the lowest retum? Click on "Get more help" menu, then select "Spreadsheet" to see Table 8.1-Year-by-Year Returns, 1950-1999 Table 8.1 Year-by-Year Returns, 1950-1999 \begin{tabular}{|l|c|c|c|c|} \hline Year & Three-MonthU.S.TreasuryBills & Long-TermGovernmentBonds & LargeCompanyStocks & SmallCompanyStocks \\ \hline 1950 & 1.20% & 0.96% & 32.68% & 48.45% \\ \hline 1951 & 1.49% & 1.95% & 23.47% & 9.41% \\ \hline 1952 & 1.66% & 1.93% & 18.91% & 6.36% \\ \hline 1953 & 1.82% & 3.83% & 1.74% & 5.66% \\ \hline 1954 & 0.86% & 4.88% & 52.55% & 65.13% \\ \hline 1955 & 1.57% & 1.34% & 31.44% & 21.84% \\ \hline 1956 & 2.46% & 5.12% & 6.45% & 3.82% \\ \hline 1957 & 3.14% & 9.46% & 11.14% & 15.03% \\ \hline 1958 & 1.54% & 3.71% & 43.78% & 70.63% \\ \hline 1959 & 2.95% & 3.55% & 12.95% & 17.82% \\ \hline 1960 & 2.66% & 13.78% & 0.19% & 5.16% \\ \hline 1961 & 2.13% & 0.19% & 27.63% & 30.48% \\ \hline 1962 & 2.72% & 6.81% & 8.79% & 16.41% \\ \hline 1963 & 3.12% & 0.49% & 22.63% & 12.20% \\ \hline 1964 & 3.54% & 4.51% & 16.67% & 18.75% \\ \hline 1965 & 3.94% & 0.27% & 12.50% & 37.67% \\ \hline 1966 & 4.77% & 3.70% & 10.25% & 8.08% \\ \hline 1967 & 4.24% & 7.41% & 24.11% & 103.39% \\ \hline 1968 & 5.24% & 1.20% & 11.00% & 50.61% \\ \hline 1969 & 6.59% & 6.52% & 8.33% & 32.27% \\ \hline 1970 & 6.50% & 12.69% & 4.10% & 16.54% \\ \hline 1971 & 4.34% & 17.47% & 14.17% & 18.44% \\ \hline 1972 & 3.81% & 5.55% & 19.14% & 0.62% \\ \hline 1973 & 6.91% & 1.40% & 14.75% & 40.54% \\ \hline 1974 & 7.93% & 5.53% & 26.40% & 29.74% \\ \hline 1975 & 5.80% & 8.50% & 37.26% & 69.54% \\ \hline 1976 & 5.06% & 11.07% & 23.98% & 54.81% \\ \hline \end{tabular} Avore sources ror annua retums are the Center for Research on Security Prices, Standard \&Poor's 500 index, Russell 2000 index, and Solomon-Smith Bamey U.S. Treasury bill index. Historical returns. Calculate the arithmetic average retum of U.S. Treasury bills, long-term government bonds, and large-company stocks for 1990 to 1999. Which had the highest retum? Which had the lowest retum? Click on "Get more help" menu, then select "Spreadsheet" to see Table 8.1-Year-by-Year Returns, 1950-1999 Table 8.1 Year-by-Year Returns, 1950-1999 \begin{tabular}{|l|c|c|c|c|} \hline Year & Three-MonthU.S.TreasuryBills & Long-TermGovernmentBonds & LargeCompanyStocks & SmallCompanyStocks \\ \hline 1950 & 1.20% & 0.96% & 32.68% & 48.45% \\ \hline 1951 & 1.49% & 1.95% & 23.47% & 9.41% \\ \hline 1952 & 1.66% & 1.93% & 18.91% & 6.36% \\ \hline 1953 & 1.82% & 3.83% & 1.74% & 5.66% \\ \hline 1954 & 0.86% & 4.88% & 52.55% & 65.13% \\ \hline 1955 & 1.57% & 1.34% & 31.44% & 21.84% \\ \hline 1956 & 2.46% & 5.12% & 6.45% & 3.82% \\ \hline 1957 & 3.14% & 9.46% & 11.14% & 15.03% \\ \hline 1958 & 1.54% & 3.71% & 43.78% & 70.63% \\ \hline 1959 & 2.95% & 3.55% & 12.95% & 17.82% \\ \hline 1960 & 2.66% & 13.78% & 0.19% & 5.16% \\ \hline 1961 & 2.13% & 0.19% & 27.63% & 30.48% \\ \hline 1962 & 2.72% & 6.81% & 8.79% & 16.41% \\ \hline 1963 & 3.12% & 0.49% & 22.63% & 12.20% \\ \hline 1964 & 3.54% & 4.51% & 16.67% & 18.75% \\ \hline 1965 & 3.94% & 0.27% & 12.50% & 37.67% \\ \hline 1966 & 4.77% & 3.70% & 10.25% & 8.08% \\ \hline 1967 & 4.24% & 7.41% & 24.11% & 103.39% \\ \hline 1968 & 5.24% & 1.20% & 11.00% & 50.61% \\ \hline 1969 & 6.59% & 6.52% & 8.33% & 32.27% \\ \hline 1970 & 6.50% & 12.69% & 4.10% & 16.54% \\ \hline 1971 & 4.34% & 17.47% & 14.17% & 18.44% \\ \hline 1972 & 3.81% & 5.55% & 19.14% & 0.62% \\ \hline 1973 & 6.91% & 1.40% & 14.75% & 40.54% \\ \hline 1974 & 7.93% & 5.53% & 26.40% & 29.74% \\ \hline 1975 & 5.80% & 8.50% & 37.26% & 69.54% \\ \hline 1976 & 5.06% & 11.07% & 23.98% & 54.81% \\ \hline \end{tabular} Avore sources ror annua retums are the Center for Research on Security Prices, Standard \&Poor's 500 index, Russell 2000 index, and Solomon-Smith Bamey U.S. Treasury bill index


