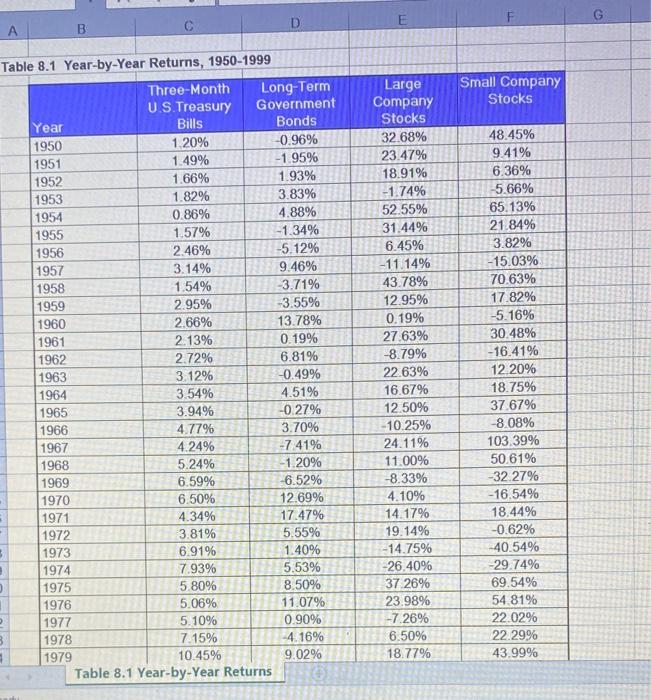
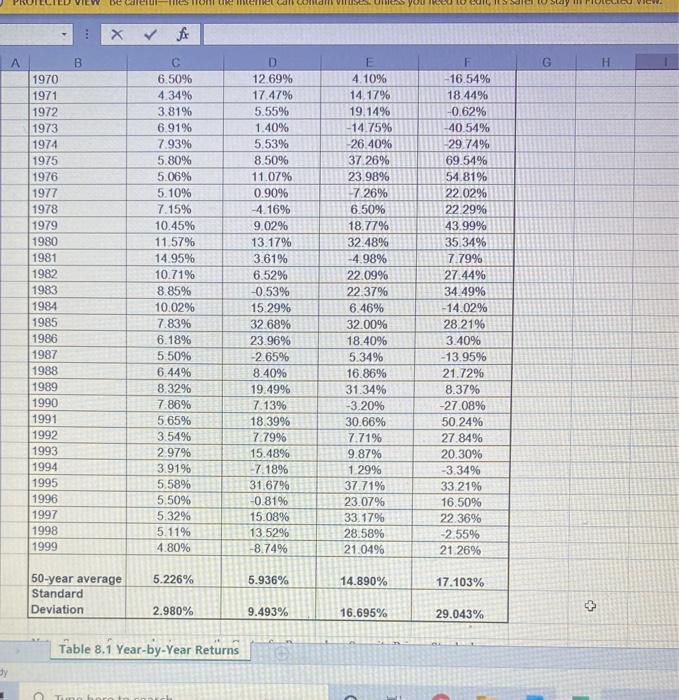
Historical returns Calculate the arithmetic average return of US Treasury bills, long-term government bonds, and large company stocks for 1987 to 1996. Which had the highest return? Which had the lowest return? On the left side, click on the Spreadsheet Learning Aid to see Table 8. 1-Year-by. Year Returns, 1950-1999 What is the average return of US Treasury bills for 1987 to 19967 553 % (Round to two decimal places) What is the average return of long-term government bonds for 1987 to 19969 0% (Round to two decimal places) Enter your answer in the answer box and then click Check Answer 3 parts remaining Con E G A B Small Company Stocks Table 8.1 Year-by-Year Returns, 1950-1999 Three-Month Long-Term U.S.Treasury Government Year Bills Bonds 1950 1.20% -0.96% 1951 1.49% -1.95% 1952 1.66% 1.93% 1953 1.82% 3.83% 1954 0.86% 4.88% 1955 1.57% -1.34% 1956 2.46% -5.12% 1957 3.14% 9.46% 1958 1.54% -3.71% 1959 2.95% -3.55% 1960 2.66% 13.78% 1961 2.13% 0.19% 1962 2.72% 6.81% 1963 3.12% -0.49% 1964 3,54% 4.51% 1965 3.94% -0.27% 1966 4.77% 3.70% 1967 4.24% -7 41% 1968 5.24% -1.20% 1969 6.59% -6.52% 1970 6.50% 12.69% 1971 4.34% 17.47% - 1972 3.81% 5.55% 3 1973 6.91% 1.40% 1974 7.93% 5.53% 1975 5.80% 8.50% 1976 5.06% 11.07% 1977 5.10% 0.90% 3 1978 7.15% -4.16% 1979 10.45% 9.02% Table 8.1 Year-by-Year Returns Large Company Stocks 32.68% 23.47% 18.91% -1.74% 52.55% 31.44% 6.45% -11.14% 43.78% 12.95% 0.19% 27.63% -8.79% 22.63% 16.67% 12.50% -10.25% 24.11% 11.00% -8.33% 4.10% 14.17% 19.14% -14.75% 26.40% 37 26% 23.98% -7.26% 6.50% 18.77% 48.45% 9.41% 6.36% -5.66% 65.13% 21.84% 3.82% -15.03% 70.63% 17.82% -5.16% 30.48% -16.41% 12. 20% 18.75% 37 67% -8.08% 103.39% 50.61% -32.27% -16.54% 18.44% -0.62% -40.54% -29.74% 69.54% 54.81% 22.02% 22.29% 43.99% en mellan contaminen Unters you x & fr B G A 1970 1971 1972 1973 1974 1975 1976 1977 1978 1979 1980 1981 1982 1983 1984 1985 1986 1987 1988 1989 1990 1991 1992 1993 1994 1995 1996 1997 1998 1999 C 6.50% 4.34% 3.81% 6.91% 7.93% 5.80% 5.06% 5.10% 7.15% 10.45% 11.57% 14.95% 10.71% 8.85% 10.02% 7.83% 6.18% 5.50% 6.44% 8.32% 7.86% 5.65% 3.54% 2.97% 3.91% 5.58% 5.50% 5.32% 5.11% 4.80% D 12.69% 17.47% 5.55% 1.40% 5.53% 8.50% 11.07% 0.90% -4.16% 9.02% 13.17% 3.61% 6.52% -0.53% 15.29% 32.68% 23.96% 2.65% 8.40% 19.49% 7.13% 18.39% 7.79% 15.48% -7.18% 31.67% -0.81% 15.08% 13.52% -8.74% E 4.10% 14.17% 19.14% -14.75% 26.40% 37 26% 23.98% -7 26% 6.50% 18.77% 32.48% -4.98% 22.09% 22.37% 6.46% 32.00% 18.40% 5 34% 16.86% 31.34% -3.20% 30.66% 7.71% 9.87% 1.2996 37.71% 23.0796 33.17% 28.58% 21.0496 -16.54% 18.44% -0.62% 40.54% -29 74% 69.54% 54.81% 22.02% 22 29% 43.99% 35.34% 7.79% 27.44% 34.49% -14.02% 28.21% 3.40% -13.95% 21.72% 8.37% -27.08% 50.24% 27.84% 20.30% -3.34% 33.21% 16.50% 22 36% -2.55% 21 26% 5.226% 5.936% 14.890% 17.103% 50-year average Standard Deviation + 2.980% 9.493% 16.695% 29.043% Table 8.1 Year-by-Year Returns By