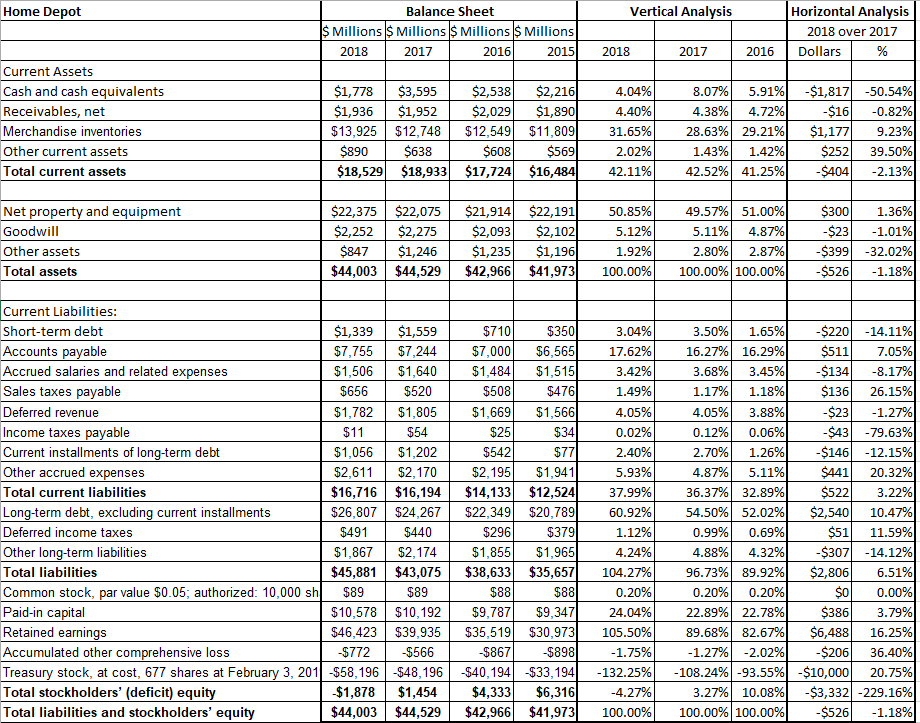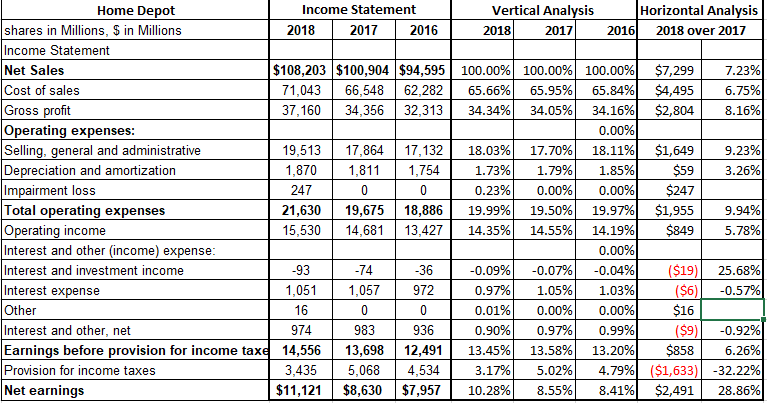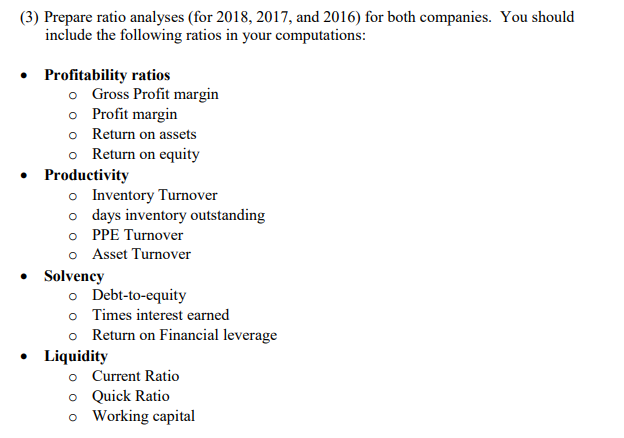


Home Depot Vertical Analysis Balance Sheet $ Millions $ Millions $ Millions $ Millions 2018 2017 2016 2015 Horizontal Analysis 2018 over 2017 Dollars % 2018 2017 2016 Current Assets Cash and cash equivalents Receivables, net Merchandise inventories Other current assets Total current assets $1,778 $3,595 $2,538 $2,216 $1,936 $1,952 $2,029 $1,890 $13,925 $12,748 $12,549 $11,809 $890 $638 $608 $5691 $18,529 $18,933 $17,724 $16,484 4.04% 4.40% 31.65% 2.02% 42.11% 8.07% 5.91% 4.38% 4.72% 28.63% 29.21% 1.43% 1.42% 42.52% 41.25% -$1,817 -$16 $1,177 $252 -$404 -50.54% -0.82% 9.23% 39.50% -2.13% Net property and equipment Goodwill Other assets Total assets $22,375 $22,075 $2,252 $2,275 $847 $1,246 $44,003 $44,529 $21,914 $22,191 $2,093 $2,102 $1,235 $1,196 $42,966 $41,973 50.85% 5.12% 1.92% 100.00% 49.57% 51.00% 5.11% 1.87% 2.80% 2.87% 100.00% 100.00% $300 -$23 $399 -$526 1.36% -1.01% -32.02% -1.18% Current Liabilities: Short-term debt $1,339 $1,559 Accounts payable $7,755 $7,244 Accrued salaries and related expenses $1,506 $1,640 Sales taxes payable $656 $520 Deferred revenue $1,782 $1,805 Income taxes payable $11 $54 Current installments of long-term debt $1,056 $1,202 Other accrued expenses $2,611 $2,170 Total current liabilities $16,716 $16,194 Long-term debt, excluding current installments $26,807 $24,267 Deferred income taxes $491 $440 Other long-term liabilities $1,867 $2,174 Total liabilities $45,881 $43,075 Common stock, par value $0.05; authorized: 10,000 sh $89 Paid-in capital $10,578 $10,192 Retained earnings $46,423 $39,935 Accumulated other comprehensive loss $772 -$566 Treasury stock, at cost, 677 shares at February 3, 201 -$58,196 -$48, 196 Total stockholders' (deficit) equity $1,878 $1,454 Total liabilities and stockholders' equity $44,003 $44,529 $710 $350 $7,000 $6,565 $1,484 $1,515 $508 $476 $1,669 $1,566 $25 $34 $542 $77) $2,195 $1,9411 $14,133 $12,524 $22,349 $20,789) $296 $379 $1,855 $1,965 $38,633 $35,657 $88 $88 $9,787 $9,347 $35,519 $30,973 -$867 $898 -$40,194 $33,194 $4,333 $6,316 $42,966 $41,973 3.04% 17.62% 3.42% 1.49% 4.05% 0.02% 2.40% 5.93% 37.99% 60.92% 1.12% 4.24% 104.27% 0.20% 24.04% 105.50% -1.75% -132.25% -4.27% 100.00% 3.50% 1.65% -$220 -14.11% 16.27% 16.29% $511 7.05% 3.68% 3.45% -$134 -8.17% 1.17% 1.18% $136 26.15% 4.05% 3.88% -$23 -1.27% 0.12% 0.06% -$43 -79.63% 2.70% 1.26% -$146 -12.15% 4.87% 5.11% $441 20.32% 36.37% 32.89% $522 3.22% 54.50% 52.02% $2,540 10.47% 0.99% 0.69% $51 11.59% 4.88% 4.32% $307 -14.12% 96.73% 89.92% $2,806 6.51% 0.20% 0.20% $0 0.00% 22.89% 22.78% $386 3.79% 89.68% 82.67% $6,488 16.25% -1.27% -2.02% -$206 36.40% -108.24% -93.55% -$10,000 20.75% 3.27% 10.08% -$3,332 -229.16% 100.00% 100.00% -$526 -1.18% $89 Home Depot Income Statement Vertical Analysis Horizontal Analysis shares in Millions, $ in Millions 2018 2017 2016 2018 2017 2016 2018 over 2017 Income Statement Net Sales $108,203 $100,904 $94,595 100.00% 100.00% 100.00% $7,299 7.23% Cost of sales 71,043 66,548 62,282 65.66% 65.95% 65.84% $4,495 6.75% Gross profit 37,160 34,356 32,313 34.34% 34.05% 34.16% $2,804 8.16% Operating expenses: 0.00% Selling, general and administrative 19,513 17,864 17,132 18.03% 17.70% 18.11% $1,649 9.23% Depreciation and amortization 1,870 1,811 1,754 1.73% 1.79% 1.85% $59 3.26% Impairment loss 247 0 0 0.23% 0.00% 0.00% $247 Total operating expenses 21,630 19,675 18,886 19.99% 19.50% 19.97% $1,955 9.94% Operating income 15,530 14,681 13,427 14.35% 14.55% 14.19% $849 5.78% Interest and other (income) expense: 0.00% Interest and investment income -93 -0.09% -0.07% -0.04% ($19) 25.68% Interest expense 1,051 1,057 972 0.97% 1.05% 1.03% ($6) -0.57% Other 16 0 0 0.01% 0.00% 0.00% $16 Interest and other, net 974 983 936 0.90% 0.97% 0.99% ($9) -0.92% Earnings before provision for income taxe 14,556 13,698 12,491 13.45% 13.58% 13.20% $858 6.26% Provision for income taxes 3,435 5,068 4,534 3.17% 5.02% 4.79% ($1,633) -32.22% Net earnings $11,121 $8,630 $7,957 10.28% 8.55% 8.41% $2,491 28.86% -74 -36 (3) Prepare ratio analyses (for 2018, 2017, and 2016) for both companies. You should include the following ratios in your computations: Profitability ratios o Gross Profit margin o Profit margin o Return on assets o Return on equity Productivity Inventory Turnover o days inventory outstanding OPPE Turnover o Asset Turnover Solvency Debt-to-equity o Times interest earned o Return on Financial leverage Liquidity O Current Ratio o Quick Ratio o Working capital


