Question
HomeNets target market is upscale residential smart homes and home offices. Based on extensive marketing surveys, the sales forecast for HomeNet is 100,000 units per
HomeNets target market is upscale residential smart homes and home offices. Based on extensive marketing surveys, the sales forecast for HomeNet is 100,000 units per year. Given the pace of technological change, Linksys expects the product will have a four-year life. It will be sold through high-end electronics stores for a retail price of $375, with an expected wholesale price of $260. Developing the new hardware will be relatively inexpensive, as existing technologies can be simply repackaged in a newly designed, home-friendly box. Industrial design teams will make the box and its packaging aesthetically pleasing to the residential market. Linksys expects total engineering and design costs to amount to $5 million. Once the design is finalized, actual production will be outsourced at a cost (including packaging) of $110 per unit. In addition to the hardware requirements, Linksys must build a new software application to allow virtual control of the home from the Web. This software development project requires coordination with each of the Web appliance manufacturers and is expected to take a dedicated team of 50 software engineers a full year to complete. The cost of a software engineer (including benefits and related costs) is $200,000 per year. To verify the compatibility of new consumer Internet-ready appliances with the HomeNet system as they become available, Linksys must also install new equipment that will require an upfront investment of $7.5 million. The software and hardware design will be completed, and the new equipment will be operational, at the end of one year. At that time, HomeNet will be ready to ship. Linksys expects to spend $2.8 million per year on marketing and support for this product.
Sales of 50 000 units in year 1, 100 000 units in year 2, 100 000 units in year 3 and 50 000 units in year 4.
Sales price of $260/unit (remain constant); cost per unit - $115/unit (remain constant)
calculate FCF for the year 4
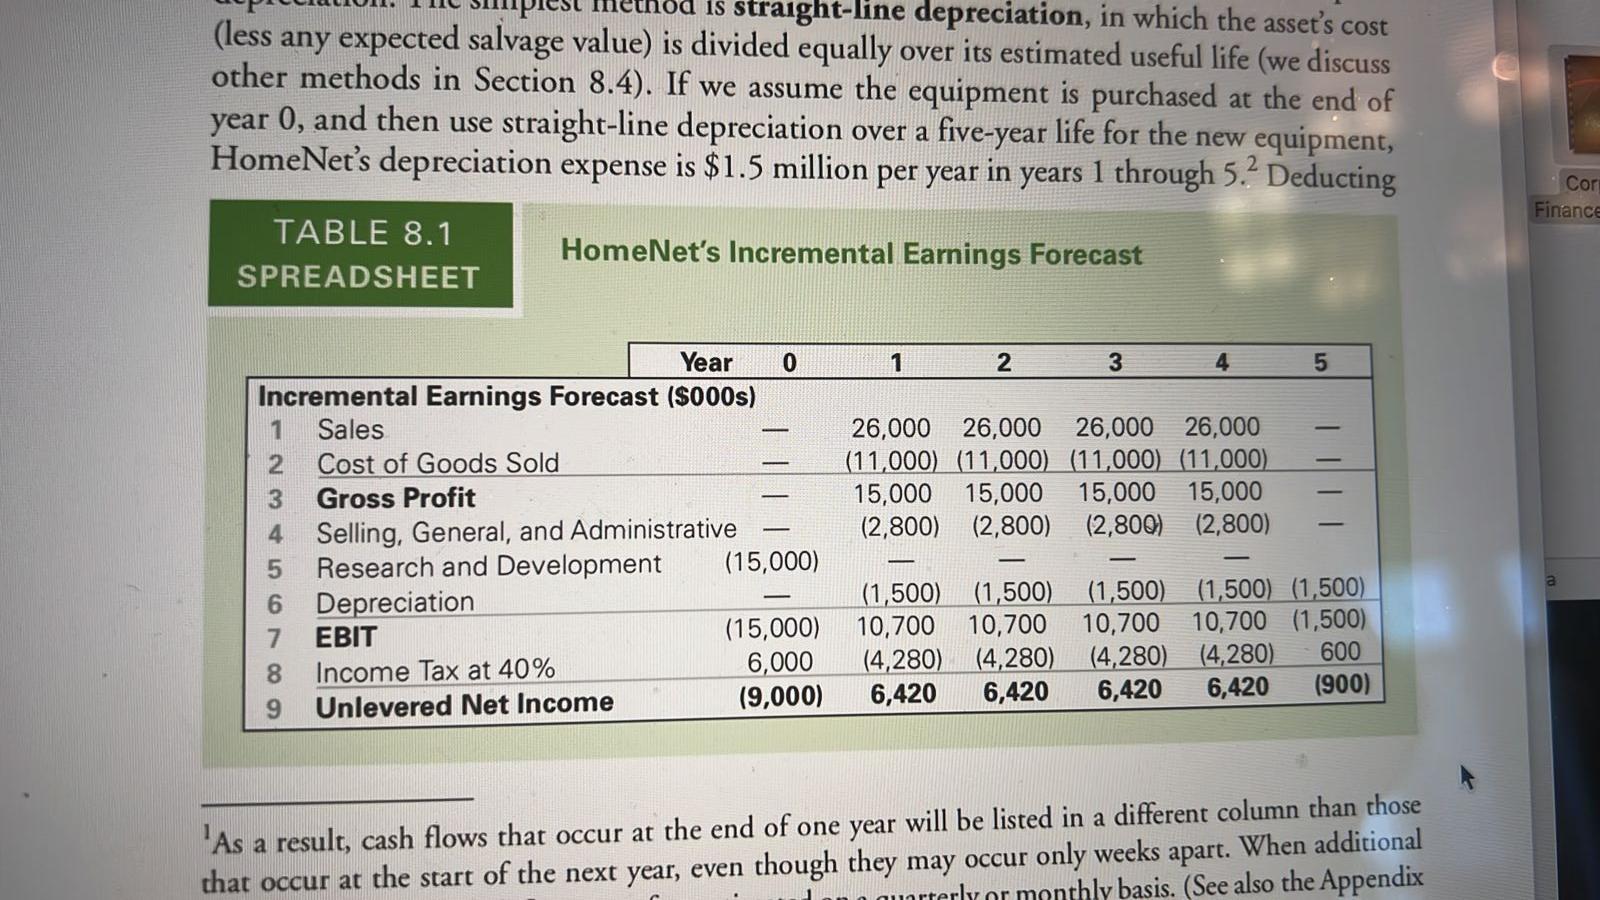
straight-line depreciation, in which the asset's cost (less any expected salvage value) is divided equally over its estimated useful life (we discuss other methods in Section 8.4). If we assume the equipment is purchased at the end of year 0, and then use straight-line depreciation over a five-year life for the new equipment, HomeNet's depreciation expense is $1.5 million per year in years 1 through 5. Deducting Cor Finance TABLE 8.1 SPREADSHEET HomeNet's Incremental Earnings Forecast 1 2 3 5 Year 0 Incremental Earnings Forecast ($000s) 1 Sales 2 Cost of Goods Sold 3 Gross Profit 4 Selling, General, and Administrative 5 Research and Development (15,000) 6 Depreciation 7 EBIT (15,000) 8 Income Tax at 40% 6,000 9 Unlevered Net Income (9,000) 26,000 26,000 26,000 26,000 (11,000) (11,000) (11,000) (11,000) 15,000 15,000 15,000 15,000 (2,800) (2,800) (2,800) (2,800) 0 000 7 (1,500 (1,500) 10,700 10,700 (4,280) (4,280) 6,420 6,420 (1,500) (1,500) (1,500) 10,700 10,700 (1,500) (4,280) (4,280) 600 6,420 6,420 (900) a 'As a result, cash flows that occur at the end of one year will be listed in a different column than those that occur at the start of the next year, even though they may occur only weeks apart. When additional urterly or monthly basis. (See also the Appendix straight-line depreciation, in which the asset's cost (less any expected salvage value) is divided equally over its estimated useful life (we discuss other methods in Section 8.4). If we assume the equipment is purchased at the end of year 0, and then use straight-line depreciation over a five-year life for the new equipment, HomeNet's depreciation expense is $1.5 million per year in years 1 through 5. Deducting Cor Finance TABLE 8.1 SPREADSHEET HomeNet's Incremental Earnings Forecast 1 2 3 5 Year 0 Incremental Earnings Forecast ($000s) 1 Sales 2 Cost of Goods Sold 3 Gross Profit 4 Selling, General, and Administrative 5 Research and Development (15,000) 6 Depreciation 7 EBIT (15,000) 8 Income Tax at 40% 6,000 9 Unlevered Net Income (9,000) 26,000 26,000 26,000 26,000 (11,000) (11,000) (11,000) (11,000) 15,000 15,000 15,000 15,000 (2,800) (2,800) (2,800) (2,800) 0 000 7 (1,500 (1,500) 10,700 10,700 (4,280) (4,280) 6,420 6,420 (1,500) (1,500) (1,500) 10,700 10,700 (1,500) (4,280) (4,280) 600 6,420 6,420 (900) a 'As a result, cash flows that occur at the end of one year will be listed in a different column than those that occur at the start of the next year, even though they may occur only weeks apart. When additional urterly or monthly basis. (See also the AppendixStep by Step Solution
There are 3 Steps involved in it
Step: 1

Get Instant Access to Expert-Tailored Solutions
See step-by-step solutions with expert insights and AI powered tools for academic success
Step: 2

Step: 3
Ace Your Homework with AI
Get the answers you need in no time with our AI-driven, step-by-step assistance
Get Started