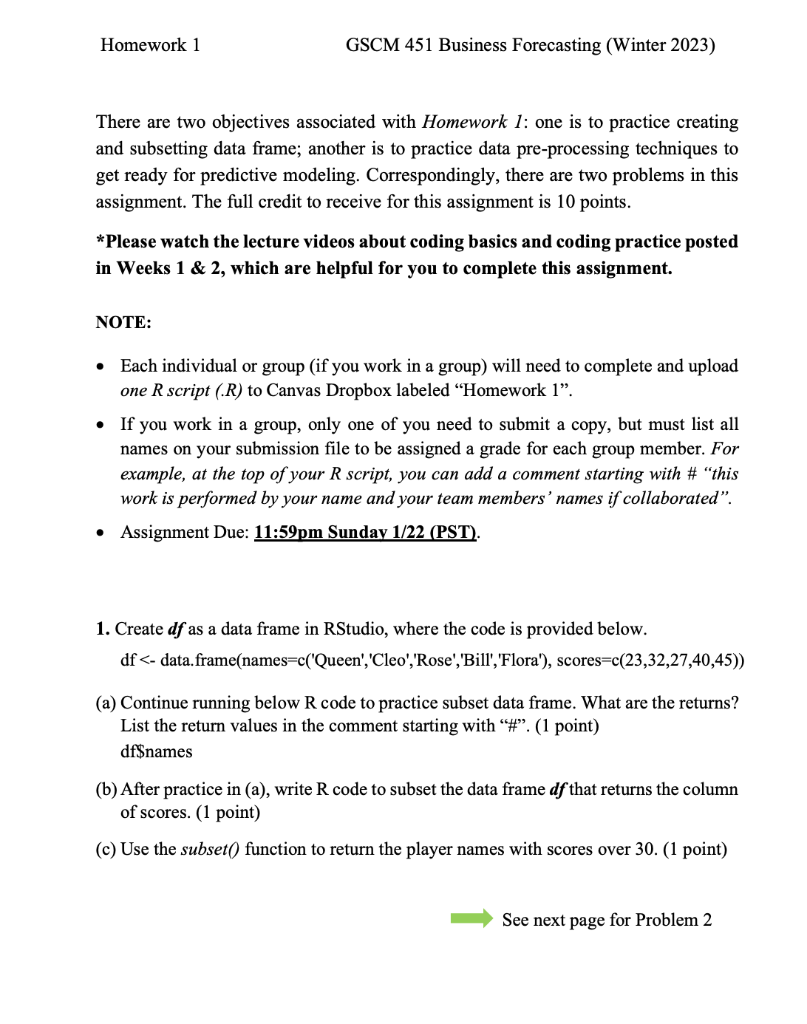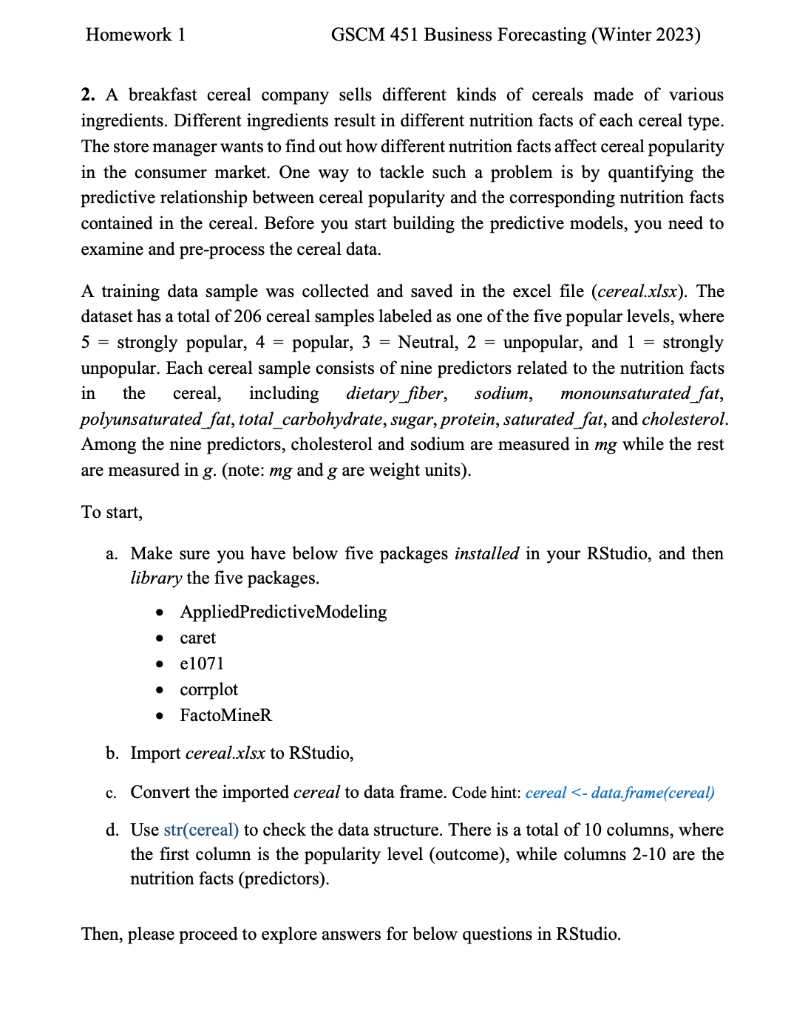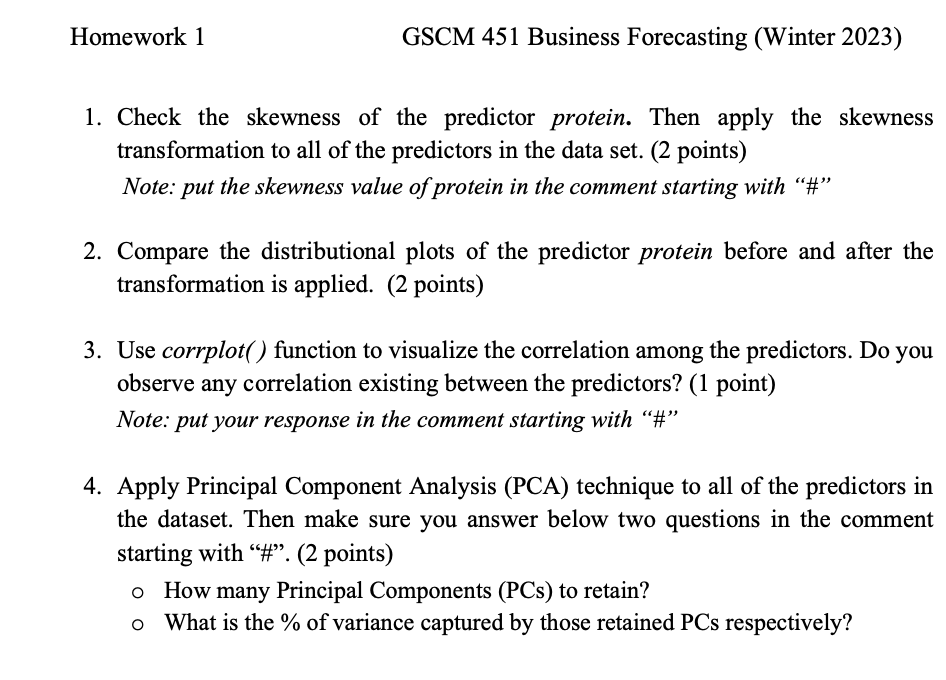


Homework 1 GSCM 451 Business Forecasting (Winter 2023) There are two objectives associated with Homework 1 : one is to practice creating and subsetting data frame; another is to practice data pre-processing techniques to get ready for predictive modeling. Correspondingly, there are two problems in this assignment. The full credit to receive for this assignment is 10 points. * Please watch the lecture videos about coding basics and coding practice posted in Weeks 1&2, which are helpful for you to complete this assignment. NOTE: - Each individual or group (if you work in a group) will need to complete and upload one R script (.R) to Canvas Dropbox labeled "Homework 1". - If you work in a group, only one of you need to submit a copy, but must list all names on your submission file to be assigned a grade for each group member. For example, at the top of your R script, you can add a comment starting with \# "this work is performed by your name and your team members' names if collaborated". - Assignment Due: 11:59pm Sundav 1/22 (PST). 1. Create df as a data frame in RStudio, where the code is provided below. df = c('Queen', 'Cleo','Rose', 'Bill', 'Flora'), scores =c(23,32,27,40,45) ) (a) Continue running below R code to practice subset data frame. What are the returns? List the return values in the comment starting with "\#". (1 point) df\$names (b) After practice in (a), write R code to subset the data frame df that returns the column of scores. (1 point) (c) Use the subset() function to return the player names with scores over 30. (1 point) See next page for Problem 2 Homework 1 GSCM 451 Business Forecasting (Winter 2023) 2. A breakfast cereal company sells different kinds of cereals made of various ingredients. Different ingredients result in different nutrition facts of each cereal type. The store manager wants to find out how different nutrition facts affect cereal popularity in the consumer market. One way to tackle such a problem is by quantifying the predictive relationship between cereal popularity and the corresponding nutrition facts contained in the cereal. Before you start building the predictive models, you need to examine and pre-process the cereal data. A training data sample was collected and saved in the excel file (cereal.xlsx). The dataset has a total of 206 cereal samples labeled as one of the five popular levels, where 5 = strongly popular, 4 = popular, 3 = Neutral, 2 = unpopular, and 1= strongly unpopular. Each cereal sample consists of nine predictors related to the nutrition facts in the cereal, including dietary_fiber, sodium, monounsaturated_fat, polyunsaturated_fat, total_carbohydrate, sugar, protein, saturated_fat, and cholesterol. Among the nine predictors, cholesterol and sodium are measured in mg while the rest are measured in g. (note: mg and g are weight units). To start, a. Make sure you have below five packages installed in your RStudio, and then library the five packages. - AppliedPredictiveModeling - caret - e1071 - corrplot - FactoMineR b. Import cereal.xlsx to RStudio, c. Convert the imported cereal to data frame. Code hint: cereal


