Homework 10.5 Statistics
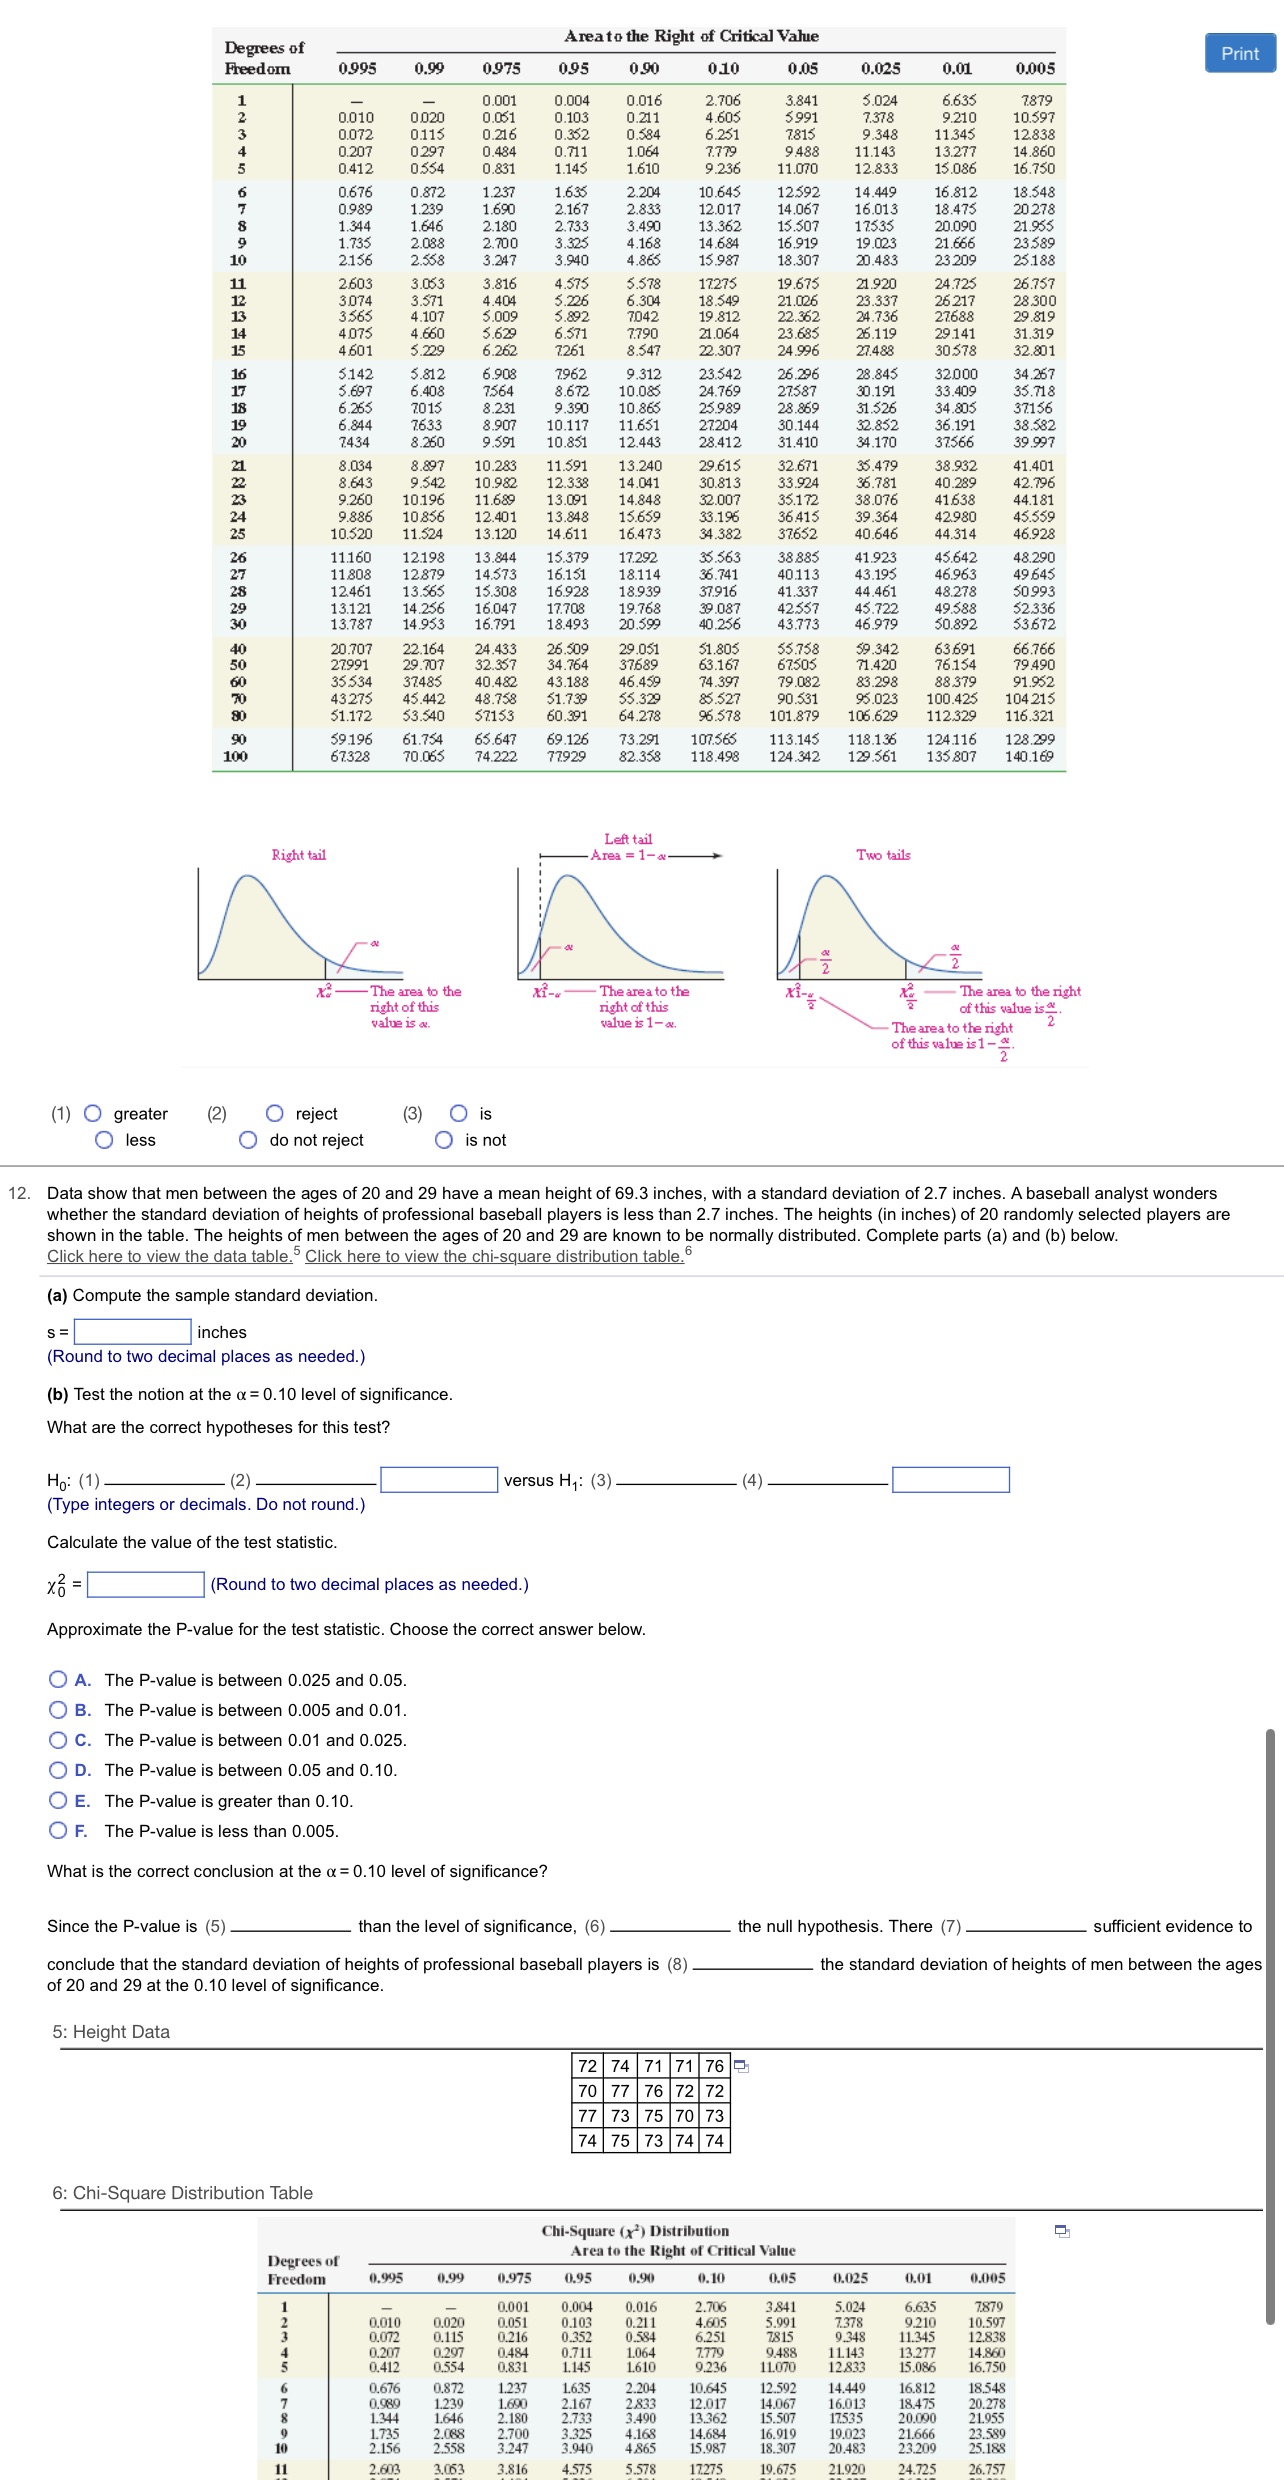
Degrees of Area to the Right of Critical Value Print Freedom 0.995 0.99 0.975 0.95 0.90 0.10 0.05 0.025 0.01 0.005 0.001 0.004 .016 2.106 3.841 3.024 6.635 7879 0.010 0.020 0.051 0.103 J.21 4.605 5991 7.378 9.210 10.597 0.072 0115 0.216 0.352 0.58 6.251 7815 9.348 11.34 12.838 0.207 0297 0.484 0.711 1.064 7.779 9488 11.143 13.277 14.860 0.412 0354 0.831 1.145 1.610 9.236 11.070 12.833 15.086 16.750 0.676 0.872 1.237 1.635 2.204 10.645 12592 14.449 16.812 18.54 3.98 1.239 1.690 2.167 2.83 12.01 14.067 16.013 18.47 20 27 1.344 1.646 2.180 2.733 3.490 13.362 15.507 17535 20.090 21.955 1.73 2.088 2700 3.32 4.168 14.684 16.919 19.023 21.666 23589 2.156 2.53 3.247 3.940 4.865 15.987 18.307 20.483 23 209 25.188 2603 3.06 3.816 1.575 5.578 17275 19.675 21.920 24.72 26.757 3074 3.571 4.404 5.226 6.304 18.549 21.026 23.337 26 217 8.300 356 4.107 5.009 3.892 7042 19.812 22.362 24.736 27688 29 819 4075 4.660 5.629 6.571 7.790 21.064 23.685 26.119 29.141 $1.319 4601 5.229 6 262 3261 8.54 22.307 24.996 27.488 30578 32.801 $14 5.812 6.908 7962 9.312 23547 26.296 28.845 32000 4.267 5.69 6.408 3564 8.672 10.085 24.769 27587 30.19 33.409 $5.718 5.26 2015 8 231 9.390 10.86 25.989 28.859 31.526 34.805 37156 5.84 7633 8.907 10.11 11.651 27204 30.144 32.852 36.191 38.582 7434 8.260 9.591 10.851 12.443 28.412 31.410 34.170 37566 39.99 1.03 3.897 10.283 11.591 13.240 29.615 32.671 35.479 38.932 1.401 3.64 9.542 10.982 12.338 14.041 30.81 33.924 36.781 40.289 42.796 9.260 10.196 11.689 13.091 14.848 32.007 35.172 38.076 41638 44.181 9.886 10.856 12.401 13.848 15.659 33.196 36 .415 39.364 42.980 15.559 10.520 11.524 13.120 14.611 16.473 34.382 37652 40.646 44.314 46.928 11.160 12.198 13.844 15.379 17.292 35.563 38 885 41.923 45.642 48.290 1808 12879 14.573 16.151 18.114 36.741 40.113 43.195 46.963 49 64 12461 13.565 15.308 16.928 18.939 37.916 41.337 44.46 48.278 50993 13.121 14.256 16.047 17.708 19.768 39.087 42557 45.722 49.588 $2.336 13.787 14.953 16.791 18.493 20.599 10.256 43.773 16.979 50.892 53672 20.707 22.164 24.433 26.509 29.051 51.805 55.758 59.342 63 691 66.766 27991 29.707 32.357 34.764 37689 63.167 67505 71.420 76.154 19 490 35 534 37485 40.482 43.188 46.459 74.397 79.082 83.298 88.379 91.952 43275 45.442 48.758 $1.739 55.329 85.527 90.531 95.023 100.425 104 215 $1.172 53.540 57153 60.391 64.278 96.578 101.879 106.629 112.329 116.321 59.196 61.754 65.647 69.126 73.291 107.565 113.145 118.136 124.116 128.299 100 5732 70.065 74.222 77929 82.35 118.498 124.342 129.561 135 807 140.169 Left tail Right tail Area = 1-a Two tails - The area to the xi- - The area to the xi- The area to the right right of this right of this of this value is at value is a. value is 1-a. The area to the right of this value is 1 -. (1) O greater (2) O reject (3) O is less O do not reject O is not 12. Data show that men between the ages of 20 and 29 have a mean height of 69.3 inches, with a standard deviation of 2.7 inches. A baseball analyst wonders whether the standard deviation of heights of professional baseball players is less than 2.7 inches. The heights (in inches) of 20 randomly selected players are shown in the table. The heights of men between the ages of 20 and 29 are known to be normally distributed. Complete parts (a) and (b) below. Click here to view the data table. " Click here to view the chi-square distribution table. (a) Compute the sample standard deviation. s = inches (Round to two decimal places as needed.) b) Test the notion at the or = 0.10 level of significance. What are the correct hypotheses for this test? Ho: (1 ) versus H 1 : ( 3 ) (4) (Type integers or decimals. Do not round.) Calculate the value of the test statistic. (Round to two decimal places as needed.) Approximate the P-value for the test statistic. Choose the correct answer below. O A. The P-value is between 0.025 and 0.05. O B. The P-value is between 0.005 and 0.01. O C. The P-value is between 0.01 and 0.025. O D. The P-value is between 0.05 and 0. 10. O E. The P-value is greater than 0.10. OF. The P-value is less than 0.005. What is the correct conclusion at the o = 0.10 level of significance? Since the P-value is (5) than the level of significance, (6) the null hypothesis. There (7) sufficient evidence to conclude that the standard deviation of heights of professional baseball players is (8) the standard deviation of heights of men between the ages of 20 and 29 at the 0.10 level of significance. 5: Height Data 72 74 71 71 76 70 77 76 72 72 77 73 75 70 73 74 75 73 74 7 6: Chi-Square Distribution Table Chi-Square (x2) Distribution Degrees of Area to the Right of Critical Value Freedom 0.995 0.99 0.975 0.95 0.90 0.10 0.05 0.025 0.01 0.005 0.001 0.004 0.016 2.706 3.841 5.024 6.635 7879 0.010 0.020 0.051 0.103 0.211 4.605 5.991 7.378 9.210 10.597 0.072 0.115 0.216 0.352 0.584 6.251 7815 9.348 1.345 12.838 0.207 0.297 0.484 0.711 1.064 7.779 9.488 11.143 13.277 14.860 0.412 0.554 0.831 1.145 1.610 0236 11.070 12.833 15.086 16.750 BONA MAWNE 0.676 0.872 1.237 1.635 2.204 10.64 12.592 14 440 16.812 18.548 0.989 1.239 1.690 2.167 2.833 12.01 14.067 16.013 18.475 20.278 1.344 1.646 2.180 2.733 3.490 13.362 5.507 17535 20.090 21.955 1.735 2.08 2.700 3.32 4.16 14.684 16.919 19.023 21.666 23.589 2.558 3.247 3.040 4.865 15.987 18.307 20.483 23.209 25.188 2.603 3.053 3.816 4.575 5.578 17.275 19.675 21.920 24.725 26.757