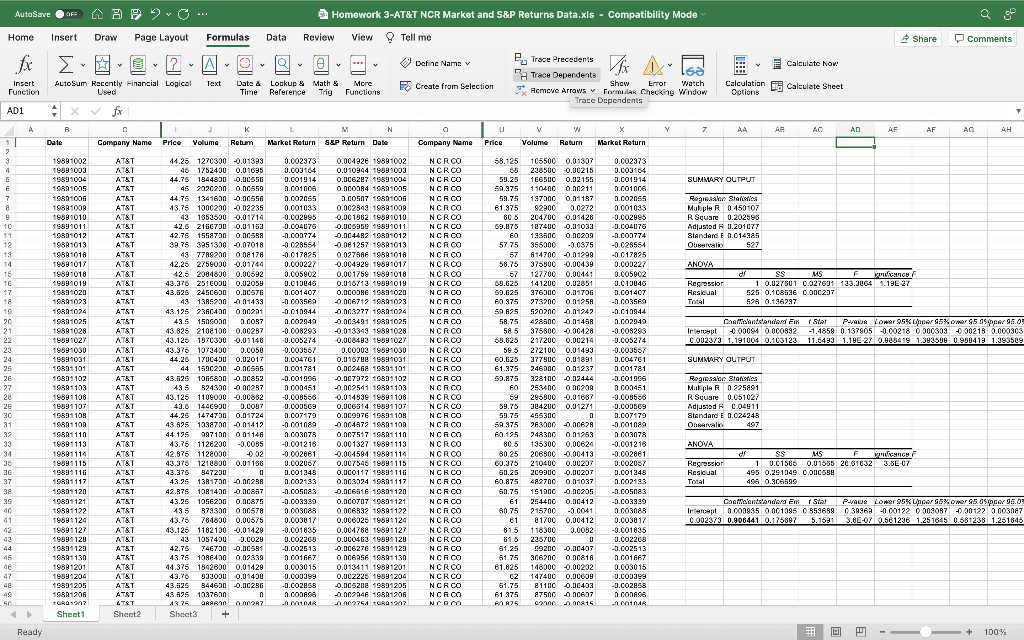
Homework 3
Use the data in the AT&T-NCR spreadsheet. For each company, the spreadsheet shows the daily
return for AT&T, NCR, S&P500, and the Market Index with value-weighted returns.
For each company, estimate the equation for Normal Returns by running the following simple
regression (also known as the Market Model) with daily returns:
RAT&T = a + b RM
For each company, estimate two Normal Returns equations by using S&P500 and the Value
Weighted Index.
Rj,t = a + b RM,t + Error term
Use these Normal Returns equations to calculate Abnormal Returns on each Event Day during
AT&Ts takeover bids for NCR. The event dates are described in Table 1 (Report Date) of the
paper An Analysis of Value Destruction in AT&Ts Acquisition of NCR, Journal of Financial
Economics 39 (1995), by Lys and Vincent.
Abnormal Return on an Event Date = Actual Return - Normal Return
Summarize your results (including Regression output and Abnormal Returns) for both firms and
compare to the numbers in the paper by Lys and Vincent
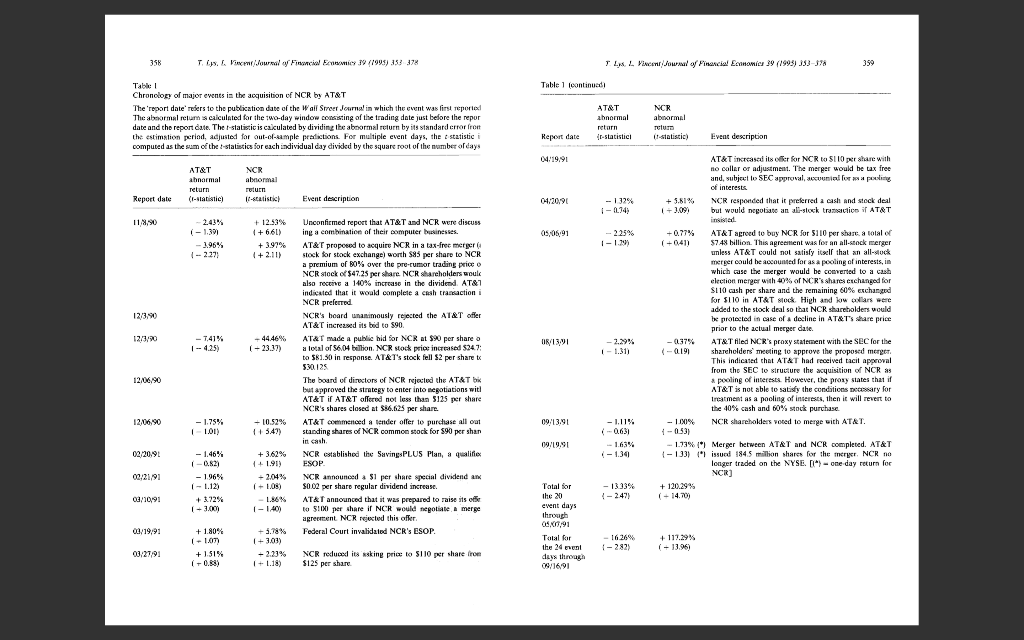
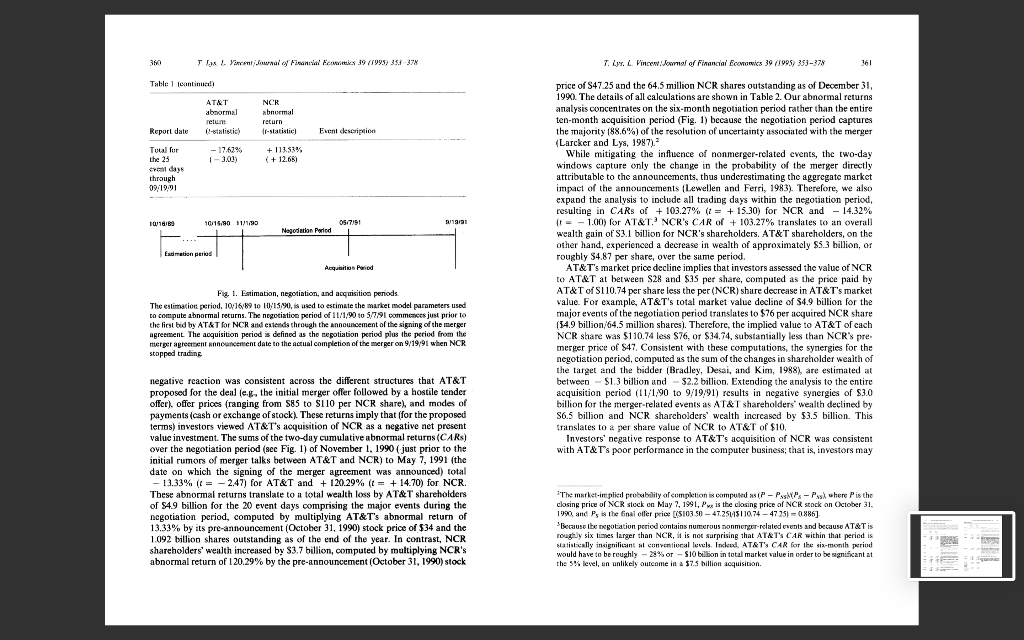
358 T. L. Vir Journal y Financial my 19 (1995) 152 378 TL L Vincent Jowu Pinancial manier 39 (1993) 353-3? 359 Table 1 Leontinued Table Chronology of major events in the acquisition of NCR by AT&T The report date' refers to the publication date of the Wall Streer Journal in which the event was first reportex The abnormal retum calculated for the two-day window consisting of the trading date just before the repor date and the report date. The statistic is calculated by dividing the abnormal return by its Standard crror front the estimation period, adjusted for out-of-xample prelictions for multiple event days, the statistici computed as the sum of the statistics for each individual day divickd by the square root of the number of days AT&T abnormal return {r-statistici NCR abnormal TOUT it statistic) Repert date Event description 1901 AT&T abnormal return r) (F-statistic) NCR allormal return 12-satish Report date Event description 04.20,90 -32% 1 - 194) 118,90 -2.43% (-1.391 -3.96% OS 05,91 + 12.53% 1 + 66L) + 3.97% (+2.11) -2.25% 1 - 1.39) 12/3/90 AT&T increased its offer for NCR to S110 per share with no coller or adjustment. The merger would be tax free and, subject to SEC approval, accuenial for a paling of interests + 5.61% NCR responded that it preferred a cash and stock deal but would negotiate an all-stock tractice if AT&T inside +0.77% AT&T agreed to buy NCR for 5110 per share a total of (+0,411 57.48 billion. This agreement was for an all-stock merger unless AT&T could not satisfy itself that an all-stock merger could be accounted for as a pooling of interests, in which case the merger would be converted to a cash election merger with 40% of NCR's shares exchanged for S110 cash per share and the remaining 60% exchanged for 5110 in AT&T slock High and low ears were added to the stock deal so that NCR shareholders would be protected in case of a decline in AT&T share price prior to the actual merger date. -0.37% AT&T Aled NCR's proxy statement with the SEC for the (-0.191 shareholders' meeting to approve the proposed morgen This indicated that AT&T had received tacit approval from the SEC to structure the acquisition of NCR as * pooling of intereses. However, the proxy states that if AT&T is not able to satisfy the conditions assary for Treatment as a pooling of interests, then it will revert to the 40% cash and 60% stock purchase - 11/0% NCR shareholders voted to merge with ATAT. 1 -0.53) -1.93% 1 Merger between AT&T and NCR completed. AT&T 1 - 133) 1" issued 184.5 million shares for the merger. NCR 10 longer traded on the NYSE. [") - one day return for NCR) + 120.29% 1-14.70) 12/3/90 -7,41% 1 -4.25) - 44.46% 1-23.37) 08/13 - 2.29% 1 - 1.311 Unconfirmed report that AT&T and NCR were discuss ing a combination of their computer businesses. AT&T proposed to acquire NCR in a tax-frec merger stock for stock exchange worth $85 per share to NCR a premium of 80% over the pre-cumor trading price NCR stock of $47.25 per share. NCR Shareholders would also receive a 140% increase in the dividend AT&T indicated that it would complete a cash transaction i NCR preferred NCR's board unanimously rejected the AT&T offer AT&T increased its bid to 590 AT&T made a public bid for NCR at $90 per share o a lotal of 56.04 billion NCR stock price increased $24.7: to $81.50 in response. AT&T's stock fell S2 per share to 530125 The board of directors of NCR rejected the ATAT but approved the strategy to enter into negotiations with AT&T ir AT&T offered not less than 5125 per share NCR's shares closed at $36.625 per share. AT&T commenced a tender offer to purchase all out standing shares of NCR common stock for 590 per shan in cash NCR established the SavingsPLUS Pan, a qualifiex ESOP NCR announced 51 per share special dividend an $0.02 per share regular dividend increase. AT&T announced that it was prepared to raise its of to $10 per share ir NCR would negotiate a merge agreement NCR rejected this offer Federal Court invalidated NCR's ESOP. 12/06,90 12/05/90 09, 13.91 -1.75% 11.01) - 10.52% 5.47) - 1.11% (-0.631 09/1991 02/2019 1-1.34 -1.46% 1 -0.821 + 3,62% 1 + 1.91) -2,04% 1 + 1.09) 00:21/91 - 1.96% 1 - 1.12) +372% 1-3.001 -13.33% {-247 00/1001 1-1.40) 00:19,91 +1.80% 11.07 + 1.51% 10.83) + 117.29% Total for the 20 event days through 0803,91 Total for the 24 meni duys through 09/16/91 +5.78% (303) - 2.23% 1 + 1.18) -16 269 1-282) 03/27/9: NCR reduced its asking pric to 5110 share from $125 per share 310 Ta Yake Jawal / Porn 19 (1998) 354 374 7. Lys. 2. Vincennal of Financial Economics 39 (1995) 353-378 361 Table feontinued ATAT abnormal NOR abnormal return |r-slatialia) Report date relm 1-sintisic) Event description Tuial for the 25 - 17.62% 1-3.02) + 113.53% (+ 12.651 through 09/19/91 110/80 10/15/80 11/1190 05/7191 Nagoration Period Edmation paris Acquisition and price of S47.25 and the 64.5 million NCR shares outstanding as of December 31, 1990. The details of all calculations are shown in Table 2. Our abnormal returns analysis concentrates on the six-month negotiation period rather than the entire ten-month acquisition period (Fig. 1) because the negotiation period captures the majority 188.6%) of the resolution of uncertainty associated with the merger (Larcker and Lys, 1987). While mitigating the influence of nonmerger-related cvents, the two-day window's capture only the change in the probability of the merger directly attributable to the announcements, thus underestimating the aggregate market impact of the announcements (Lewellen and Ferri, 1983). Therefore, we also expand the analysis to include all trading days within the negotiation period, resulting in CARs of + 103.27% (t = + 15.30) for NCR and 14.32% tt = -1.00) for AT&T. NCR'S CAR of + 103.27% translates to an overall wealth gain of 3.1 billion for NCR's shareholders. AT&T shareholders, on the other hand, experienced a decrease in wealth of approximately $5.3 billion, or roughly 54.87 per share, over the same period. AT&T's market price decline implies that investors assessed the value of NCR to AT&T at between S28 and $35 per share, computed as the price paid by AT&T of S1 10.74 per share less the per (NCR) share decrease in AT&T's market value. For example, AT&T's total market value decline of $4.9 billion for the major events of the negotiation period translates to $76 per acquired NCR share (14.9 billion, 64.5 million shares). Therefore, the implied value to AT&T of each NCR share was $110.74 less $76, or $34.74, substantially les than NCR's pre- merger price of $47. Consistent with these computations, the synergies for the the target and the bidder (Bradley, Desai, and Kim, 1988), are estimated at negotiation period, computed as the sum of the changes in shareholder wealth of between - S13 bilion and - $2.2 billion. Extending the analysis to the entire acquisition period (11/1/90 to 9/19:91) results in negative synergies of $3.0 billion for the merger-related events as AT&T shareholders' wealth declined by S6.5 billion and NCR shareholders' wealth increased by $3.5 billion. This translates to a per share value of NCR to AT&T of $10. Investors' negative response to AT&T's acquisition of NCR was consistent with AT&T's poor performance in the computer business that is, investors may Fig. 1. Estimation, negotiation, and acquisition periods. The estimation period. 10/16/89 10 115.99 is used to estimate the market model parameters used to compute abnormal returns. The negotiation period of 11/1,90 40 5/7/91 commences just prior to the first bid by AT&T for NCR and extends through the announcement of the signing of the merger agreement. The acquisition period is defined as the negotiation period plus the period from the merger agreement announcement date to the actual completion of the merger on 9/1991 when NCR stopped trading negative reaction was consistent across the different structures that AT&T proposed for the deal leg, the initial merger offer followed by a hostile tender offer). offer prices (ranging from $85 to SI10 per NCR share), and modes of payments (cash or exchange of stock). These returns imply that (for the proposed ters) investors viewed AT&T's acquisition of NCR as a negative net present value investment. The sums of the two-day cumulative abnormal returns (CARS) over the negotiation period (see Fig. 1) of November 1, 1990 (just prior to the initial rumors of merger talks between AT&T and NCR) to May 7, 1991 (the date on which the signing of the merger agreement was announced) total - 13.33% f = -2.47) for AT&T and + 120.29% (t = + 14.70) for NCR. These abnormal returns translate to a total wealth loss by AT&T shareholders of $4.9 billion for the 20 event days comprising the major events during the negotiation period, computed by multiplying AT&T's abnormal return of 13.33% by its pre-announcement (October 31, 1990) stock price of $34 and the 1.092 billion shares outstanding as of the end of the year. In contrast, NCR shareholders' wealth increased by $3.7 billion, computed by multiplying NCR's abnormal return of 120.29% by the pre-announcement (October 31, 1990) stock The market-implied probability of completion is computed as IP - PMPs - Pys where is the closing price of NCR stock on May 2, 1991, Pw is the closing price of NCR stock on October 31, 1990 and Ps is the final oller price [15103.50 - 47.25413110.74 - 47 25) = 0886). Because be negotiation period contains numerous nonmerger-related events and because AT&T is roughly six times larger than NCR, it is not surprising that ATATS CAR within that period is statistically insignificant al conventional levels. Inched. AT&T's CAR for the six-month period would have to be roughly - 2%or - S10 billion in total market value in order to be significant at the 5% level, an unlikely outcome in a $7.5 billion acquisition AutoSave OF AAP. G... Homework 3-AT&T NCR Market and S&P Returns Data.xls - Compatibility Mode Home Insert Draw Page Layout Formulas Data Review View Tell me Share Comments fx E. S.O. 2 Datinc Name The E Calculate Now - 160 ! e Trace Precedents Trace Dependente Show Error Watch Hemove Arrows Formular Checking Window Trace Dependents Create from Selection Insert Function AD1 Calculation calculate Sheet Options AutoSum Recently Financial Logical Text Date & Lookup & Math & More Used Time Reference Trig functions xfx M N Date Company Name Price Volume Rebum Market Return S&P Return Date A a U X Y Z Z AA AB AC AD AF AF AH V Volume Return Price Market Return SUMMARY OUTPUT Regrann Star Muluple R 0.450107 R Square 0.202598 Adjusted R 0.201077 Standard F 0.014385 Observatio 527 ANOVA Regrasslor Residual Total dr SS ASF keinen 1 0.027801 0.027601 133.3464 1.19E 27 525 0.108536 0.00C237 528 0.196297 Coalfidantstanden en stat pe lower 95% 95% wargs as per 9.5.09 P-or omor 85 Intercept -0.00094 0.000832 -1.4858 0.137905 -0.00218 0.000303 0.00218 0.000303 0.002373 1.191004 0.100123 11.6493 1.19E-27 0.108419 1.393608 0.930419 1.193509 2 3 4 E 6 7 8 9 10 11 12 1.9 14 15 16 17 18 16 20 21 22 23 24 25 26 27 28 29 30 31 32 33 34 35 36 37 38 39 40 41 92 42 SUMMARY OUTPUT 19881002 19091003 19891004 16891005 16891006 18881039 19891010 1989-1011 1.6891012 19881013 18881018 19891017 19891018 19091019 19891020 16891023 16891024 16891025 19891028 19891027 19891030 19891031 19891101 19894102 188A1103 19891108 19891107 19891108 18891109 16801110 19891113 19881114 19891115 19891116 18891117 19891120 19891121 18891122 19891124 19891127 19891120 19891129 16891136 19891201 19991204 19891205 16891208 GROS 2017 EL Sheet1 AT&T AT&T AT&T AT&T AT&T AT&T AT&T AT&T AT&T AT&T AT&T AT&T AT&T AT&T AT&T AT&T AT&T ATST AT&T AT&T AT&T AT&T ATST AT&T AT&T AT&T AT&T ATAT AT&T AT&T AT&T AT&T AT&T T AT&T AT&T AT&T AT&T AT&T T AT&T AT&T AT&T AT&T AT&T AT&T AT&T AT&T AT&T Sheet2 44.25 1270300 -0,01383 46 1752400 0.01695 44.75 1944890 -0.00650 452020200 0.00559 44.75 1341600 -0.00556 13.75 1000290 -0.02235 43 1858590 0.01714 42.6 2166700 -0.01152 42.75 1558700 0.00588 39.75 3951300 -0.07018 43 7788200 0.08176 42.26 2758000 -0.01744 42.5 2004800 0.00592 43.376 2516000 0.02059 43.525 2450600 0.00576 49 13R5250 -0.01433 43.125 9300430 236049 0.001 43.5 1509000 3.COR7 13.825 2108100 0.00287 43.125 1970300 -0.01148 43.376 1073400 0.0050 44.26 170C400 0.02017 44 44 1690200 0.00585 43.5251006850 -0.00852 43.5 24300 -0.00287 43.125 1108030 -0.00882 43.6 1440900 0.0097 44.25 1474730 0.01724 43 825 1038700 -0.01412 44.195 997100 0.01146 43.75 1126200 -O.COBS 42.875 1128030 -0.02 43.378 1210800 0.01186 43.375 347200 43.25 13R1700 0.00288 42.875 1081430 -0.0087 43.25 1056230 0.00875 43.5 873350 879330 0.00578 43.78 784800 0.00675 43.125 1182100 -0.01428 43 1057400 43 0.0029 42.75 74E700 0.00581 43.75 10R6400 0.02339 44.375 1842630 0.01428 43.76 033090 0.01400 43.525344600 0.0C286 43.825 1037600 n 1375 GRAN 227 Shect3 + 0.002373 0.003104 0.001914 0.001008 0.002055 0.001033 -0.002895 -U.C04075 -0.000774 -0.028554 -0.017825 0.000227 0.005902 0.010046 0.001407 -0.0035 -0.010944 0.002949 -0.008283 -0.005274 -0.003567 0.004761 0.001781 -0.001998 0.000451 -0.008558 0.CO0569 0.007179 -0.001089 0.003078 -0.001218 -0.002861 0.002007 0.001248 0.002138 -0.005083 -0.003339 0.003028 0.003017 -0.001835 0.002269 -0.002513 0.001667 0.003015 0.000399 -0.00263 0.0ODASS 0001010 0.004928 1989 1002 0.010944 16091003 0.006287 18891004 0.00084 10801005 0.00507 16891001 0.002843 18891009 0.001562 19691010 0.006959 19891011 0.004482 16891012 -0.06 1257 18881013 0.02788 19891018 -0.004929 1909 1017 0.001759 19891018 0.01671319891019 0.0CORE 15891020 -0.006712 1901023 -0.003277 16891024 0.003491 1989-1025 -0.013343 18681028 -0.008493 19091027 0.00003 1989 1030 0.016798 19891031 0.002468 16891101 0.007972 15891102 -0.002541 18881103 -0.014838 18891108 0.006314 16591107 0.009976 1589110R -0.004872 18891109 0.00751 7 168R1110 0.001327 19891113 -0.004584 19881114 0.007540 1939 1115 0.00011719891116 0.003924 16891117 0.00681616891120 0.000707 15891121 0.006899 198A1122 0.006025 19891124 0.004788 18891127 0.000483 19891120 0.006276 15891129 0.006856 18891130 0.013411 1980 1201 0.002220 19091204 0.005208 1989-1205 -0.007946 16891208 100275. GRO207 Company Name NCRCO NCRCO NCRCO NCRO NCRCO NCRCO NCRCO NCRCO NCR00 NCRCO NCRCO NCRCO NCRCO NCRCO NCRCO NCRO NCRCO NCRCO NCRCO NCRCO NCRCO NCRCO NCRCO NCRCO NCRCO NCROO NCRCO NCRCO NCR00 NCRCO NCRCO NCRCO NCRCO NCRCO NCRCO NCRO NCRCO NCRCO NCRCO NCRCO NCRCO NCRCO NCRCO NCRCO NCRCO NCRCO NCRCO Ncom 58.125 105500 0.01307 238500 0.00215 59.25 166500 0.02155 59.375 110400 0.00211 59.75 197000 0.01187 61.975 82900 9.0272 80.5 204700 0.01420 69.875 187400 -0.01032 60 193500 0.00200 57.75 355000 -0.0375 57 614700 -0.01298 58.75 375800 0.00439 57 127700 0.00441 63.625 141200 0.02851 59.625 376000 0.01706 60.875 273200 0.01958 59.625 520200 -0.01249 58.75 47820 0.0148R 58 5 5 375800 -0.00128 33.625 217200 0.00214 58.5 272100 0.01493 60.625 277900 0.01891 61.375 246900 0.01237 59.875 328100 0.02444 60 258400 0.00208 59 285800 -0.01687 59.75 3042000.01271 59.75 455300 0 59.375 263000 0.00628 60.125 248300 0.01283 805 135300 0.00624 80.25 206800 -0.00413 60.375 210400 0.00207 50.25 209900 0.00207 60.875 482700 0.01037 60.75 151900 0.00205 61 254400 0.00412 60.75 215700 -10041 61 81700 0.00412 815 118300 0.0082 61.5 236700 U 61.25 99200 0.00407 61.75 SCA200 0.0081A 81.825 148000 0.00202 C2 147400 0.00609 51.75 81100 0.00403 61.975 87500 0.00607 BAS 000 1100815 0.C02373 0.003104 0.001914 0.001006 0.002055 0.00103 -0.C02895 -U.CO4076 -0.003774 -0.028554 -0.017825 0.000227 0.C05802 0.010046 0.001407 -0.003569 -0.010944 0.002949 -0.008283 -0.005274 -0.003567 0.004761 0.001781 -0.001906 0.000451 -0.003556 0.CO0509 D.CO7179 -0.001089 0.003078 -0.001216 -0.002861 0.CO2067 0.001248 0.002133 -0.005083 -0.003399 0.003088 0.C03817 -0.001835 0.002265 -0.002513 0.001667 0.003015 0.000399 -O.CO2858 0.CODASS . 10A Regresan Stantones Mali plaR 0225891 R Square 0.051027 Adjusted RC04911 Standard E 0.024243 Ohservati 497 ANOVA Regression Residual Total dr SS MS F Vench 1 1 0.01565 0.01585 20.81632 3.8E-07 495 0.29 1049 0.00C68H 498 0.306899 Coefficientstanden en stat pace Lower 95 DO 5X omor 5.5 or 09.09 Em Stal Intercept 0.000935 0.001095 0853689 038368 -0.00122 0.003087 -0.00122 0.003087 0.002373 0.906441 0.175807 5.1591 3.85-07 0.561236 1.251645 0.581238 1.251845 45 46 47 48 45 50 Ready + 100% 358 T. L. Vir Journal y Financial my 19 (1995) 152 378 TL L Vincent Jowu Pinancial manier 39 (1993) 353-3? 359 Table 1 Leontinued Table Chronology of major events in the acquisition of NCR by AT&T The report date' refers to the publication date of the Wall Streer Journal in which the event was first reportex The abnormal retum calculated for the two-day window consisting of the trading date just before the repor date and the report date. The statistic is calculated by dividing the abnormal return by its Standard crror front the estimation period, adjusted for out-of-xample prelictions for multiple event days, the statistici computed as the sum of the statistics for each individual day divickd by the square root of the number of days AT&T abnormal return {r-statistici NCR abnormal TOUT it statistic) Repert date Event description 1901 AT&T abnormal return r) (F-statistic) NCR allormal return 12-satish Report date Event description 04.20,90 -32% 1 - 194) 118,90 -2.43% (-1.391 -3.96% OS 05,91 + 12.53% 1 + 66L) + 3.97% (+2.11) -2.25% 1 - 1.39) 12/3/90 AT&T increased its offer for NCR to S110 per share with no coller or adjustment. The merger would be tax free and, subject to SEC approval, accuenial for a paling of interests + 5.61% NCR responded that it preferred a cash and stock deal but would negotiate an all-stock tractice if AT&T inside +0.77% AT&T agreed to buy NCR for 5110 per share a total of (+0,411 57.48 billion. This agreement was for an all-stock merger unless AT&T could not satisfy itself that an all-stock merger could be accounted for as a pooling of interests, in which case the merger would be converted to a cash election merger with 40% of NCR's shares exchanged for S110 cash per share and the remaining 60% exchanged for 5110 in AT&T slock High and low ears were added to the stock deal so that NCR shareholders would be protected in case of a decline in AT&T share price prior to the actual merger date. -0.37% AT&T Aled NCR's proxy statement with the SEC for the (-0.191 shareholders' meeting to approve the proposed morgen This indicated that AT&T had received tacit approval from the SEC to structure the acquisition of NCR as * pooling of intereses. However, the proxy states that if AT&T is not able to satisfy the conditions assary for Treatment as a pooling of interests, then it will revert to the 40% cash and 60% stock purchase - 11/0% NCR shareholders voted to merge with ATAT. 1 -0.53) -1.93% 1 Merger between AT&T and NCR completed. AT&T 1 - 133) 1" issued 184.5 million shares for the merger. NCR 10 longer traded on the NYSE. [") - one day return for NCR) + 120.29% 1-14.70) 12/3/90 -7,41% 1 -4.25) - 44.46% 1-23.37) 08/13 - 2.29% 1 - 1.311 Unconfirmed report that AT&T and NCR were discuss ing a combination of their computer businesses. AT&T proposed to acquire NCR in a tax-frec merger stock for stock exchange worth $85 per share to NCR a premium of 80% over the pre-cumor trading price NCR stock of $47.25 per share. NCR Shareholders would also receive a 140% increase in the dividend AT&T indicated that it would complete a cash transaction i NCR preferred NCR's board unanimously rejected the AT&T offer AT&T increased its bid to 590 AT&T made a public bid for NCR at $90 per share o a lotal of 56.04 billion NCR stock price increased $24.7: to $81.50 in response. AT&T's stock fell S2 per share to 530125 The board of directors of NCR rejected the ATAT but approved the strategy to enter into negotiations with AT&T ir AT&T offered not less than 5125 per share NCR's shares closed at $36.625 per share. AT&T commenced a tender offer to purchase all out standing shares of NCR common stock for 590 per shan in cash NCR established the SavingsPLUS Pan, a qualifiex ESOP NCR announced 51 per share special dividend an $0.02 per share regular dividend increase. AT&T announced that it was prepared to raise its of to $10 per share ir NCR would negotiate a merge agreement NCR rejected this offer Federal Court invalidated NCR's ESOP. 12/06,90 12/05/90 09, 13.91 -1.75% 11.01) - 10.52% 5.47) - 1.11% (-0.631 09/1991 02/2019 1-1.34 -1.46% 1 -0.821 + 3,62% 1 + 1.91) -2,04% 1 + 1.09) 00:21/91 - 1.96% 1 - 1.12) +372% 1-3.001 -13.33% {-247 00/1001 1-1.40) 00:19,91 +1.80% 11.07 + 1.51% 10.83) + 117.29% Total for the 20 event days through 0803,91 Total for the 24 meni duys through 09/16/91 +5.78% (303) - 2.23% 1 + 1.18) -16 269 1-282) 03/27/9: NCR reduced its asking pric to 5110 share from $125 per share 310 Ta Yake Jawal / Porn 19 (1998) 354 374 7. Lys. 2. Vincennal of Financial Economics 39 (1995) 353-378 361 Table feontinued ATAT abnormal NOR abnormal return |r-slatialia) Report date relm 1-sintisic) Event description Tuial for the 25 - 17.62% 1-3.02) + 113.53% (+ 12.651 through 09/19/91 110/80 10/15/80 11/1190 05/7191 Nagoration Period Edmation paris Acquisition and price of S47.25 and the 64.5 million NCR shares outstanding as of December 31, 1990. The details of all calculations are shown in Table 2. Our abnormal returns analysis concentrates on the six-month negotiation period rather than the entire ten-month acquisition period (Fig. 1) because the negotiation period captures the majority 188.6%) of the resolution of uncertainty associated with the merger (Larcker and Lys, 1987). While mitigating the influence of nonmerger-related cvents, the two-day window's capture only the change in the probability of the merger directly attributable to the announcements, thus underestimating the aggregate market impact of the announcements (Lewellen and Ferri, 1983). Therefore, we also expand the analysis to include all trading days within the negotiation period, resulting in CARs of + 103.27% (t = + 15.30) for NCR and 14.32% tt = -1.00) for AT&T. NCR'S CAR of + 103.27% translates to an overall wealth gain of 3.1 billion for NCR's shareholders. AT&T shareholders, on the other hand, experienced a decrease in wealth of approximately $5.3 billion, or roughly 54.87 per share, over the same period. AT&T's market price decline implies that investors assessed the value of NCR to AT&T at between S28 and $35 per share, computed as the price paid by AT&T of S1 10.74 per share less the per (NCR) share decrease in AT&T's market value. For example, AT&T's total market value decline of $4.9 billion for the major events of the negotiation period translates to $76 per acquired NCR share (14.9 billion, 64.5 million shares). Therefore, the implied value to AT&T of each NCR share was $110.74 less $76, or $34.74, substantially les than NCR's pre- merger price of $47. Consistent with these computations, the synergies for the the target and the bidder (Bradley, Desai, and Kim, 1988), are estimated at negotiation period, computed as the sum of the changes in shareholder wealth of between - S13 bilion and - $2.2 billion. Extending the analysis to the entire acquisition period (11/1/90 to 9/19:91) results in negative synergies of $3.0 billion for the merger-related events as AT&T shareholders' wealth declined by S6.5 billion and NCR shareholders' wealth increased by $3.5 billion. This translates to a per share value of NCR to AT&T of $10. Investors' negative response to AT&T's acquisition of NCR was consistent with AT&T's poor performance in the computer business that is, investors may Fig. 1. Estimation, negotiation, and acquisition periods. The estimation period. 10/16/89 10 115.99 is used to estimate the market model parameters used to compute abnormal returns. The negotiation period of 11/1,90 40 5/7/91 commences just prior to the first bid by AT&T for NCR and extends through the announcement of the signing of the merger agreement. The acquisition period is defined as the negotiation period plus the period from the merger agreement announcement date to the actual completion of the merger on 9/1991 when NCR stopped trading negative reaction was consistent across the different structures that AT&T proposed for the deal leg, the initial merger offer followed by a hostile tender offer). offer prices (ranging from $85 to SI10 per NCR share), and modes of payments (cash or exchange of stock). These returns imply that (for the proposed ters) investors viewed AT&T's acquisition of NCR as a negative net present value investment. The sums of the two-day cumulative abnormal returns (CARS) over the negotiation period (see Fig. 1) of November 1, 1990 (just prior to the initial rumors of merger talks between AT&T and NCR) to May 7, 1991 (the date on which the signing of the merger agreement was announced) total - 13.33% f = -2.47) for AT&T and + 120.29% (t = + 14.70) for NCR. These abnormal returns translate to a total wealth loss by AT&T shareholders of $4.9 billion for the 20 event days comprising the major events during the negotiation period, computed by multiplying AT&T's abnormal return of 13.33% by its pre-announcement (October 31, 1990) stock price of $34 and the 1.092 billion shares outstanding as of the end of the year. In contrast, NCR shareholders' wealth increased by $3.7 billion, computed by multiplying NCR's abnormal return of 120.29% by the pre-announcement (October 31, 1990) stock The market-implied probability of completion is computed as IP - PMPs - Pys where is the closing price of NCR stock on May 2, 1991, Pw is the closing price of NCR stock on October 31, 1990 and Ps is the final oller price [15103.50 - 47.25413110.74 - 47 25) = 0886). Because be negotiation period contains numerous nonmerger-related events and because AT&T is roughly six times larger than NCR, it is not surprising that ATATS CAR within that period is statistically insignificant al conventional levels. Inched. AT&T's CAR for the six-month period would have to be roughly - 2%or - S10 billion in total market value in order to be significant at the 5% level, an unlikely outcome in a $7.5 billion acquisition AutoSave OF AAP. G... Homework 3-AT&T NCR Market and S&P Returns Data.xls - Compatibility Mode Home Insert Draw Page Layout Formulas Data Review View Tell me Share Comments fx E. S.O. 2 Datinc Name The E Calculate Now - 160 ! e Trace Precedents Trace Dependente Show Error Watch Hemove Arrows Formular Checking Window Trace Dependents Create from Selection Insert Function AD1 Calculation calculate Sheet Options AutoSum Recently Financial Logical Text Date & Lookup & Math & More Used Time Reference Trig functions xfx M N Date Company Name Price Volume Rebum Market Return S&P Return Date A a U X Y Z Z AA AB AC AD AF AF AH V Volume Return Price Market Return SUMMARY OUTPUT Regrann Star Muluple R 0.450107 R Square 0.202598 Adjusted R 0.201077 Standard F 0.014385 Observatio 527 ANOVA Regrasslor Residual Total dr SS ASF keinen 1 0.027801 0.027601 133.3464 1.19E 27 525 0.108536 0.00C237 528 0.196297 Coalfidantstanden en stat pe lower 95% 95% wargs as per 9.5.09 P-or omor 85 Intercept -0.00094 0.000832 -1.4858 0.137905 -0.00218 0.000303 0.00218 0.000303 0.002373 1.191004 0.100123 11.6493 1.19E-27 0.108419 1.393608 0.930419 1.193509 2 3 4 E 6 7 8 9 10 11 12 1.9 14 15 16 17 18 16 20 21 22 23 24 25 26 27 28 29 30 31 32 33 34 35 36 37 38 39 40 41 92 42 SUMMARY OUTPUT 19881002 19091003 19891004 16891005 16891006 18881039 19891010 1989-1011 1.6891012 19881013 18881018 19891017 19891018 19091019 19891020 16891023 16891024 16891025 19891028 19891027 19891030 19891031 19891101 19894102 188A1103 19891108 19891107 19891108 18891109 16801110 19891113 19881114 19891115 19891116 18891117 19891120 19891121 18891122 19891124 19891127 19891120 19891129 16891136 19891201 19991204 19891205 16891208 GROS 2017 EL Sheet1 AT&T AT&T AT&T AT&T AT&T AT&T AT&T AT&T AT&T AT&T AT&T AT&T AT&T AT&T AT&T AT&T AT&T ATST AT&T AT&T AT&T AT&T ATST AT&T AT&T AT&T AT&T ATAT AT&T AT&T AT&T AT&T AT&T T AT&T AT&T AT&T AT&T AT&T T AT&T AT&T AT&T AT&T AT&T AT&T AT&T AT&T AT&T Sheet2 44.25 1270300 -0,01383 46 1752400 0.01695 44.75 1944890 -0.00650 452020200 0.00559 44.75 1341600 -0.00556 13.75 1000290 -0.02235 43 1858590 0.01714 42.6 2166700 -0.01152 42.75 1558700 0.00588 39.75 3951300 -0.07018 43 7788200 0.08176 42.26 2758000 -0.01744 42.5 2004800 0.00592 43.376 2516000 0.02059 43.525 2450600 0.00576 49 13R5250 -0.01433 43.125 9300430 236049 0.001 43.5 1509000 3.COR7 13.825 2108100 0.00287 43.125 1970300 -0.01148 43.376 1073400 0.0050 44.26 170C400 0.02017 44 44 1690200 0.00585 43.5251006850 -0.00852 43.5 24300 -0.00287 43.125 1108030 -0.00882 43.6 1440900 0.0097 44.25 1474730 0.01724 43 825 1038700 -0.01412 44.195 997100 0.01146 43.75 1126200 -O.COBS 42.875 1128030 -0.02 43.378 1210800 0.01186 43.375 347200 43.25 13R1700 0.00288 42.875 1081430 -0.0087 43.25 1056230 0.00875 43.5 873350 879330 0.00578 43.78 784800 0.00675 43.125 1182100 -0.01428 43 1057400 43 0.0029 42.75 74E700 0.00581 43.75 10R6400 0.02339 44.375 1842630 0.01428 43.76 033090 0.01400 43.525344600 0.0C286 43.825 1037600 n 1375 GRAN 227 Shect3 + 0.002373 0.003104 0.001914 0.001008 0.002055 0.001033 -0.002895 -U.C04075 -0.000774 -0.028554 -0.017825 0.000227 0.005902 0.010046 0.001407 -0.0035 -0.010944 0.002949 -0.008283 -0.005274 -0.003567 0.004761 0.001781 -0.001998 0.000451 -0.008558 0.CO0569 0.007179 -0.001089 0.003078 -0.001218 -0.002861 0.002007 0.001248 0.002138 -0.005083 -0.003339 0.003028 0.003017 -0.001835 0.002269 -0.002513 0.001667 0.003015 0.000399 -0.00263 0.0ODASS 0001010 0.004928 1989 1002 0.010944 16091003 0.006287 18891004 0.00084 10801005 0.00507 16891001 0.002843 18891009 0.001562 19691010 0.006959 19891011 0.004482 16891012 -0.06 1257 18881013 0.02788 19891018 -0.004929 1909 1017 0.001759 19891018 0.01671319891019 0.0CORE 15891020 -0.006712 1901023 -0.003277 16891024 0.003491 1989-1025 -0.013343 18681028 -0.008493 19091027 0.00003 1989 1030 0.016798 19891031 0.002468 16891101 0.007972 15891102 -0.002541 18881103 -0.014838 18891108 0.006314 16591107 0.009976 1589110R -0.004872 18891109 0.00751 7 168R1110 0.001327 19891113 -0.004584 19881114 0.007540 1939 1115 0.00011719891116 0.003924 16891117 0.00681616891120 0.000707 15891121 0.006899 198A1122 0.006025 19891124 0.004788 18891127 0.000483 19891120 0.006276 15891129 0.006856 18891130 0.013411 1980 1201 0.002220 19091204 0.005208 1989-1205 -0.007946 16891208 100275. GRO207 Company Name NCRCO NCRCO NCRCO NCRO NCRCO NCRCO NCRCO NCRCO NCR00 NCRCO NCRCO NCRCO NCRCO NCRCO NCRCO NCRO NCRCO NCRCO NCRCO NCRCO NCRCO NCRCO NCRCO NCRCO NCRCO NCROO NCRCO NCRCO NCR00 NCRCO NCRCO NCRCO NCRCO NCRCO NCRCO NCRO NCRCO NCRCO NCRCO NCRCO NCRCO NCRCO NCRCO NCRCO NCRCO NCRCO NCRCO Ncom 58.125 105500 0.01307 238500 0.00215 59.25 166500 0.02155 59.375 110400 0.00211 59.75 197000 0.01187 61.975 82900 9.0272 80.5 204700 0.01420 69.875 187400 -0.01032 60 193500 0.00200 57.75 355000 -0.0375 57 614700 -0.01298 58.75 375800 0.00439 57 127700 0.00441 63.625 141200 0.02851 59.625 376000 0.01706 60.875 273200 0.01958 59.625 520200 -0.01249 58.75 47820 0.0148R 58 5 5 375800 -0.00128 33.625 217200 0.00214 58.5 272100 0.01493 60.625 277900 0.01891 61.375 246900 0.01237 59.875 328100 0.02444 60 258400 0.00208 59 285800 -0.01687 59.75 3042000.01271 59.75 455300 0 59.375 263000 0.00628 60.125 248300 0.01283 805 135300 0.00624 80.25 206800 -0.00413 60.375 210400 0.00207 50.25 209900 0.00207 60.875 482700 0.01037 60.75 151900 0.00205 61 254400 0.00412 60.75 215700 -10041 61 81700 0.00412 815 118300 0.0082 61.5 236700 U 61.25 99200 0.00407 61.75 SCA200 0.0081A 81.825 148000 0.00202 C2 147400 0.00609 51.75 81100 0.00403 61.975 87500 0.00607 BAS 000 1100815 0.C02373 0.003104 0.001914 0.001006 0.002055 0.00103 -0.C02895 -U.CO4076 -0.003774 -0.028554 -0.017825 0.000227 0.C05802 0.010046 0.001407 -0.003569 -0.010944 0.002949 -0.008283 -0.005274 -0.003567 0.004761 0.001781 -0.001906 0.000451 -0.003556 0.CO0509 D.CO7179 -0.001089 0.003078 -0.001216 -0.002861 0.CO2067 0.001248 0.002133 -0.005083 -0.003399 0.003088 0.C03817 -0.001835 0.002265 -0.002513 0.001667 0.003015 0.000399 -O.CO2858 0.CODASS . 10A Regresan Stantones Mali plaR 0225891 R Square 0.051027 Adjusted RC04911 Standard E 0.024243 Ohservati 497 ANOVA Regression Residual Total dr SS MS F Vench 1 1 0.01565 0.01585 20.81632 3.8E-07 495 0.29 1049 0.00C68H 498 0.306899 Coefficientstanden en stat pace Lower 95 DO 5X omor 5.5 or 09.09 Em Stal Intercept 0.000935 0.001095 0853689 038368 -0.00122 0.003087 -0.00122 0.003087 0.002373 0.906441 0.175807 5.1591 3.85-07 0.561236 1.251645 0.581238 1.251845 45 46 47 48 45 50 Ready + 100%