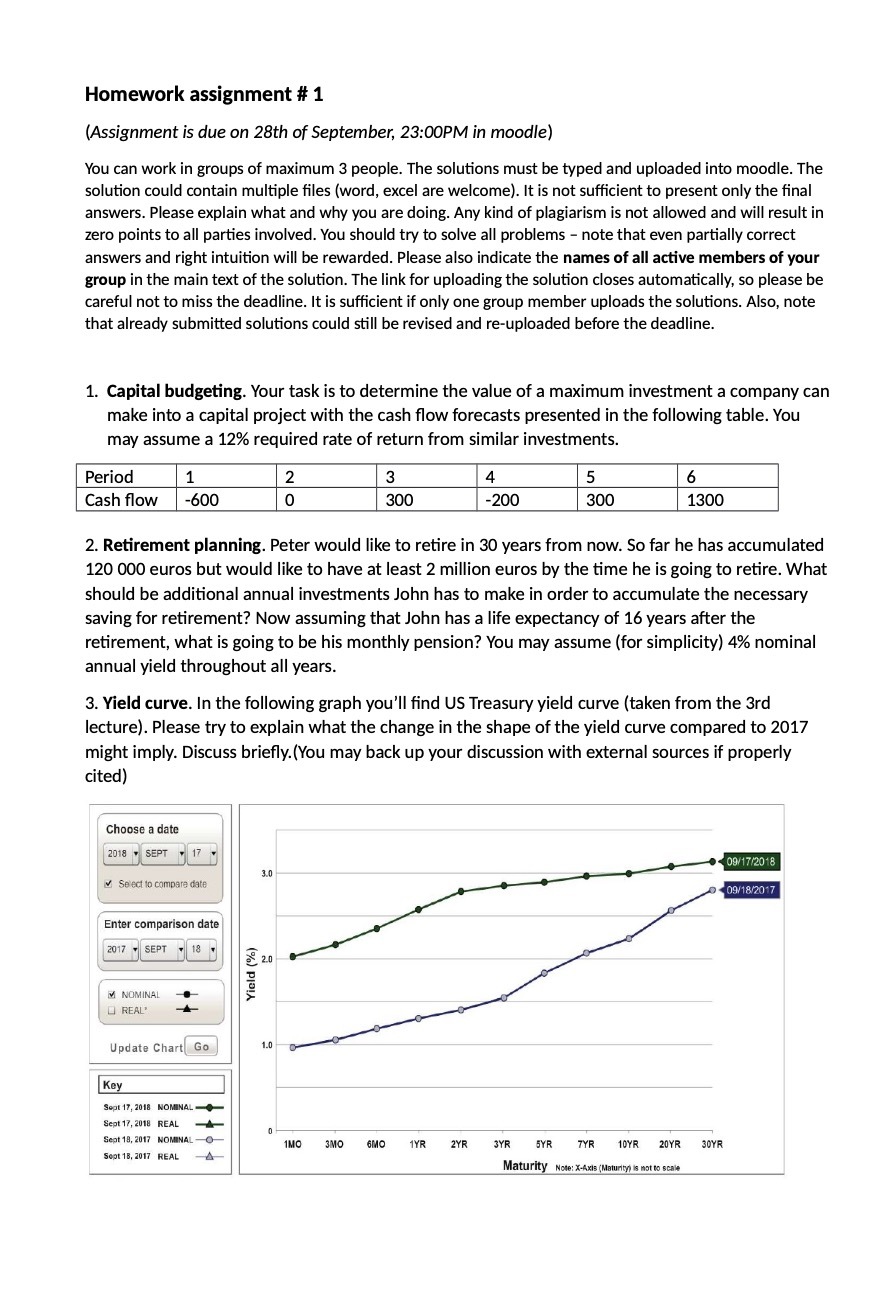
Homework assignment # 1 (Assignment is due on 28th of September, 23:00PM in moodle) You can work in groups of maximum 3 people. The solutions must be typed and uploaded into moodle. The solution could contain multiple files (word, excel are welcome). It is not sufficient to present only the final answers. Please explain what and why you are doing. Any kind of plagiarism is not allowed and will result in zero points to all parties involved. You should try to solve all problems - note that even partially correct answers and right intuition will be rewarded. Please also indicate the names of all active members of your group in the main text of the solution. The link for uploading the solution closes automatically, so please be careful not to miss the deadline. It is sufficient if only one group member uploads the solutions. Also, note that already submitted solutions could still be revised and re-uploaded before the deadline. 1. Capital budgeting. Your task is to determine the value of a maximum investment a company can make into a capital project with the cash flow forecasts presented in the following table. You may assume a 12% required rate of return from similar investments. Period 1 2 3 4 5 6 Cash flow -600 0 300 -200 300 1300 2. Retirement planning. Peter would like to retire in 30 years from now. So far he has accumulated 120 000 euros but would like to have at least 2 million euros by the time he is going to retire. What should be additional annual investments John has to make in order to accumulate the necessary saving for retirement? Now assuming that John has a life expectancy of 16 years after the retirement, what is going to be his monthly pension? You may assume (for simplicity) 4% nominal annual yield throughout all years. 3. Yield curve. In the following graph you'll find US Treasury yield curve (taken from the 3rd lecture). Please try to explain what the change in the shape of the yield curve compared to 2017 might imply. Discuss briefly.(You may back up your discussion with external sources if properly cited) Choose a date 2018 . SEPT 17 09/17/2018 3.0 Select to compare date 09/18/2017 Enter comparison date 2017 - SEPT 18 M NOMINAL REAL' Update Chart Go 1.0 Key Sept 17, 2018 NOMINAL - Sept 17, 2018 REAL Sept 18, 2017 NOMINAL -O IMO 3MO 6MO 1YR 2YR 3YR 5YR 7YR 10YR 20YR 30YR Sept 18, 2017 REAL Maturity Note: X-Axis (Maturity) is not to scale


