

Question
Homework Assignment ( 12 page maximum,180 points ) 1) MapReduce -You are given a large number of files containing positive integers. Design the MapReduce process
Homework Assignment ( 12 page maximum,180 points)
1) MapReduce -You are given a large number of files containing positive integers. Design the MapReduce process to compute the percentage of even integers across all files. Assume that your key/value pairs for the first mapper are of the form key = fileID, value = full content of the input file. For your answer: - Explain if you will use one or more MapReduce jobs. 3 points - Write the pseudo code for each mapper and reducer. 12 points - Explain briefly what does the first Mapper do. What are the key/value pairs that are OUTPUT of the first Mapper. Explain briefly what does the first Reducer do. What are the key/value pairs that are INPUT to the first Reducer. What are the key/value pairs that are OUTPUT for the first Reducer. Describe the key/value pairs in the INPUT/OUTPUT for the Mappers and Reducers in the next jobs if you use more than one MapReduce job. 10 points -Explain how the number of mappers and the number of reducers affects the efficiency of the computation. Explain how your solution makes sure many computations run in parallel. 5 points Study the midterm solutions and review the midterm discussion in lecture 9. In particular, in the last question about efficiency discuss how the number of different keys in the output of the Mapper affects the number of combiners or reducers that will be used.
2) Clustering- Use clustering code from scikit-learn http://scikit-learn.org/stable/modules/clustering.html
a) 35 points - run the kMeans example that illustrates the situations where kMeans performs well and when it does not. http://scikit-learn.org/stable/auto_examples/cluster/plot_kmeans_assumptions.html#sphx-glrauto-examples-cluster-plot-kmeans-assumptions-py Try 5 different values of k, i.e. the number of desired clusters. Make sure those values make sense based on the data you see. Explain your choices of k. Try to increase k and get more granular analysis of the data. Then try to decrease k. Explain how your change in k changes the result. Report your findings. Put the results in a summary table for an easier comparison.
b) 35 points - Run the DBScan example that illustrates how it works http://scikit-learn.org/stable/auto_examples/cluster/plot_dbscan.html - Try different combinations of the values of epsilon and min_samples. Report 9 results: Three different values for epsilon and three different values of min_samples. Use their combinations for your report. First, experiment and try many different values and increase/decrease epsilon and min_samples. See when you get very different results from the default used in the example. Make note and report your results only for the default values and for the most interesting 2 other values that you will see. Explain how your changes to these parameters change the result. Base your explanation on the definition and role of these parameters during DBScan. Put the results in a summary table for an easier comparison.
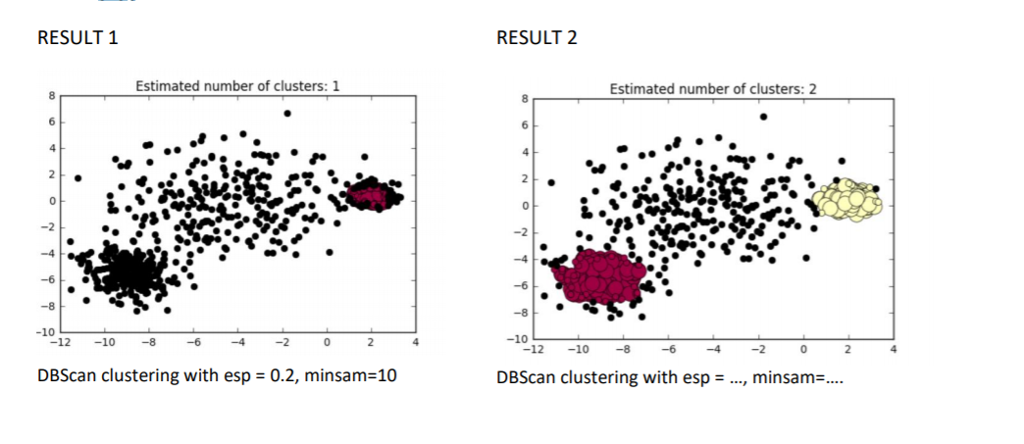
c) 35 points - Apply the transformations from the kMeans example to the DBScan input data. Experiment and and try many different values and increase/decrease epsilon and min_samples to find the combination of these parameters that produces the best result. - Report only the DBScan results for the best combination. Explain why you think those values of the parameters work best (for example, why setting epsilon to a smaller value like 0.1 could be good for the Anisotropicly transformation). What properties of the data distribution require small epsilon. - Compare to the output of kMeans with the best parameter k for each transformation. Explain using you knowledge how these algorithms work why in some cases one is better that the other. What properties of the data distribution give different results for these 2 algorithms. - Put the results in a summary table for an easier comparison. - As an example, to illustrate what is required in this question. I applied the different variance transformation to the DBScan data. With my initial guess for the values of epsilon=0.2, min_samples=10, I got the clustering in the image Result 1. After changing the values of these two paramers in different combinations I got the clustering in image Result 2. Note the black nodes are noise and are not included in clustering, according to DBScan. Experiment to find values for the parameters that give 3 clusters like kMeans did!
D) 45 points - Use the 20 news group data to cluster with kMeans http://scikit-learn.org/0.19/auto_examples/text/document_clustering.html - Read about 20 newsgroups. Provide a one paragraph description of the data set. - Try different values of the number of clusters k. Discuss what seems to be the best value, according to the evaluation, and how does it compare to what youve learned about the data. - Give the definitions of: Homogeneity, Completeness, Vmeasure. Explain how they describe the goodness of the clustering solution. - One by one, try all available transformations of the data: lsa, idf, hashing, max num features. Give their brief definitions, and report how they affect the clustering output in terms of the above measures. - Put the results in a summary table for an easier comparison. Additional Notes Screen shots It is ok to include screen shot of the clustering plots to demonstrate results. But make them small and put many images of the clustering together to use space efficiently and make it easier to compare. PUT A NUMBER and CAPTION for each clustering image that you include. Explain it in your report and the image number to refer to a particular image in your report. Add transformations to the DBScan data Use the transformations defined in the kMeans example: - Anisotropicly Distributed Blobs - Unequal Variance - Unevenly Sized Blobs Example how to add the transformation to the DBScan data
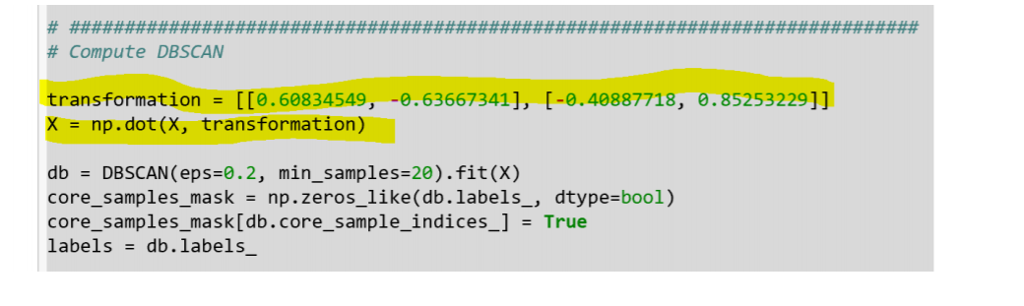 It is ok to include screen shot of the clustering plots to demonstrate results. But make them small and put many images of the clustering together to use space efficiently and make it easier to compare. PUT A NUMBER and CAPTION for each clustering image that you include. Explain it in your report and the image number to refer to a particular image in your report.
Step by Step Solution
There are 3 Steps involved in it
Step: 1

Get Instant Access to Expert-Tailored Solutions
See step-by-step solutions with expert insights and AI powered tools for academic success
Step: 2

Step: 3
Ace Your Homework with AI
Get the answers you need in no time with our AI-driven, step-by-step assistance
Get Started
Advances In Databases And Information Systems 25th European Conference Adbis 2021 Tartu Estonia August 24 26 2021 Proceedings Lncs 12843
Authors: Ladjel Bellatreche ,Marlon Dumas ,Panagiotis Karras ,Raimundas Matulevicius
1st Edition
3030824713, 978-3030824716