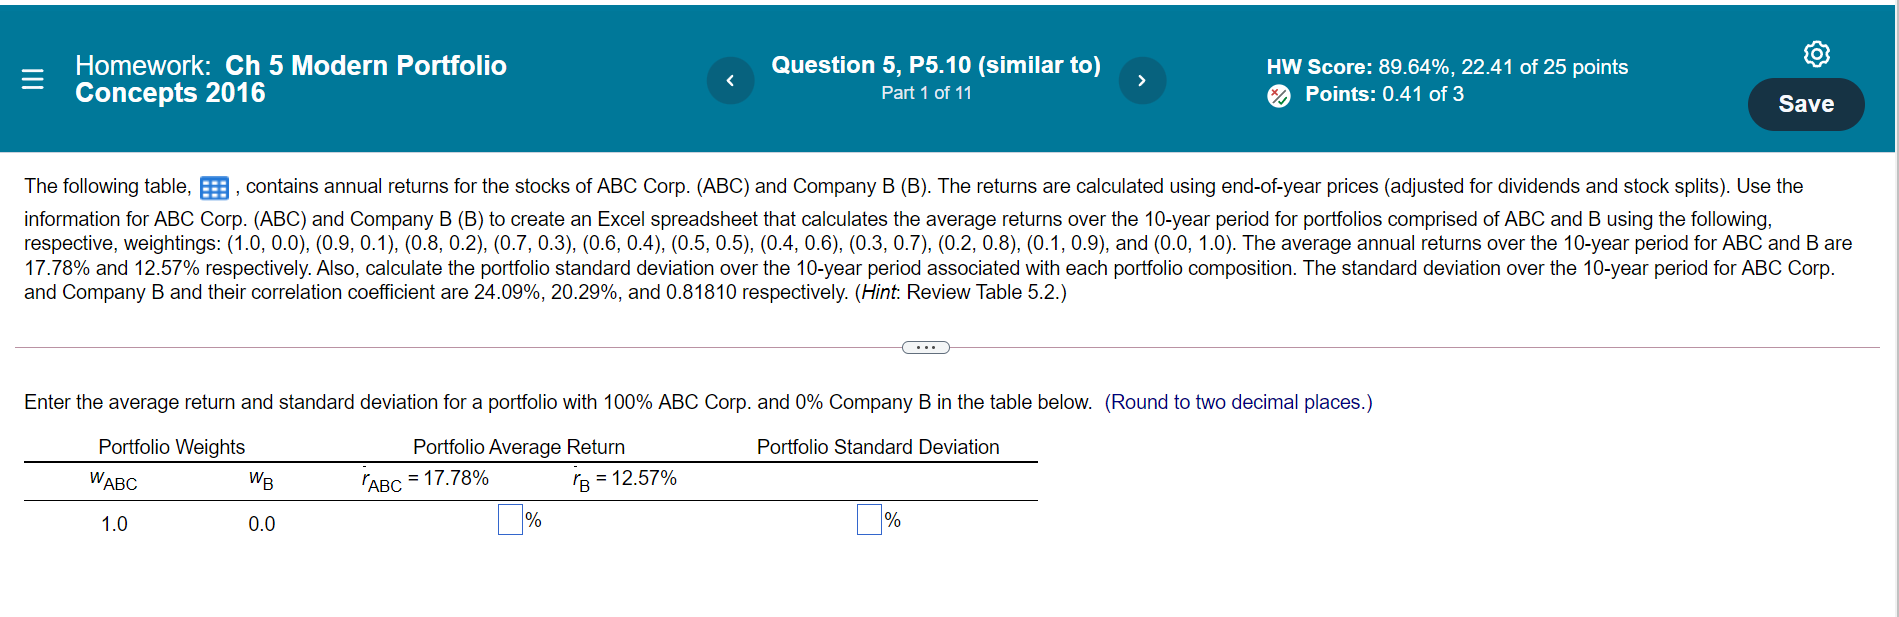
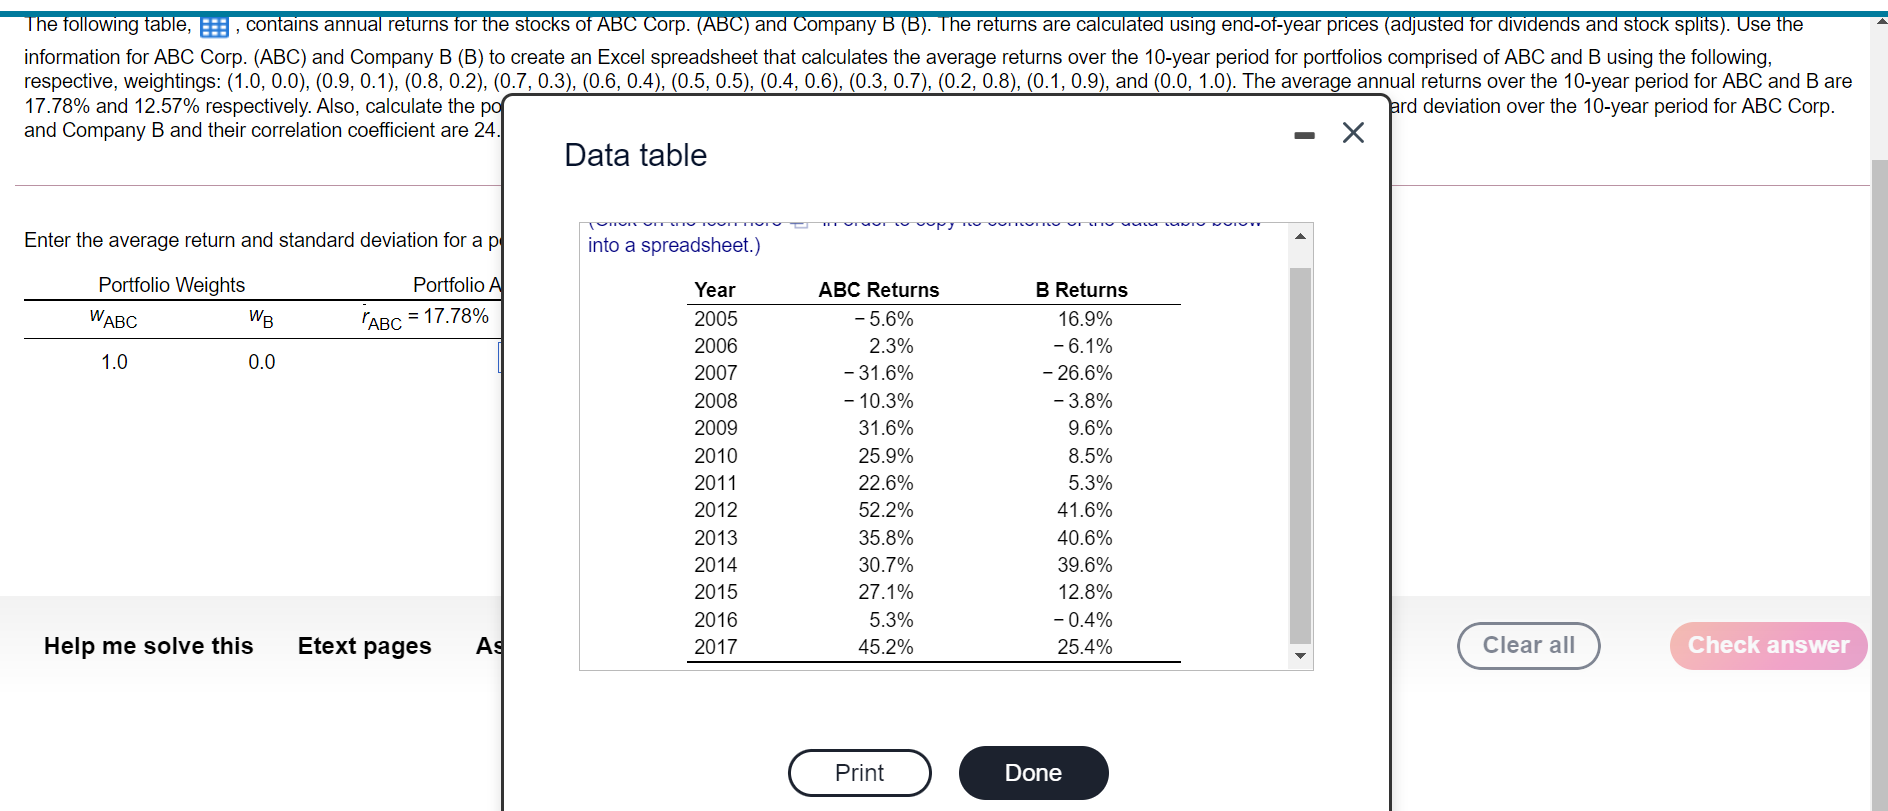
Homework: Ch 5 Modern Portfolio Concepts 2016 Question 5, P5.10 (similar to) Part 1 of 11 > HW Score: 89.64%, 22.41 of 25 points Points: 0.41 of 3 Save The following table, 3 , contains annual returns for the stocks of ABC Corp. (ABC) and Company B (B). The returns are calculated using end-of-year prices (adjusted for dividends and stock splits). Use the information for ABC Corp. (ABC) and Company B (B) to create an Excel spreadsheet that calculates the average returns over the 10-year period for portfolios comprised of ABC and B using the following, respective, weightings: (1.0, 0.0), (0.9, 0.1), (0.8, 0.2), (0.7, 0.3), (0.6, 0.4), (0.5, 0.5), (0.4, 0.6), (0.3, 0.7), (0.2, 0.8), (0.1, 0.9), and (0.0, 1.0). The average annual returns over the 10-year period for ABC and B are 17.78% and 12.57% respectively. Also, calculate the portfolio standard deviation over the 10-year period associated with each portfolio composition. The standard deviation over the 10-year period for ABC Corp. and Company B and their correlation coefficient are 24.09%, 20.29%, and 0.81810 respectively. (Hint: Review Table 5.2.) Enter the average return and standard deviation for a portfolio with 100% ABC Corp. and 0% Company B in the table below. (Round to two decimal places.) Portfolio Standard Deviation Portfolio Weights WABC WB "ABC = 17.78% Portfolio Average Return 1B = 12.57% % 1.0 0.0 % The following table, : , contains annual returns for the stocks of ABC Corp. (ABC) and Company B (B). The returns are calculated using end-of-year prices (adjusted for dividends and stock splits). Use the information for ABC Corp. (ABC) and Company B (B) to create an Excel spreadsheet that calculates the average returns over the 10-year period for portfolios comprised of ABC and B using the following, respective, weightings: (1.0, 0.0), (0.9,0.1), (0.8,0.2), (0.7, 0.3), (0.6, 0.4), (0.5, 0.5), (0.4, 0.6), (0.3, 0.7), (0.2, 0.8), (0.1, 0.9), and (0.0, 1.0). The average annual returns over the 10-year period for ABC and B are 17.78% and 12.57% respectively. Also, calculate the po ard deviation over the 10-year period for ABC Corp. and Company B and their correlation coefficient are 24. Data table INUITTO TORTTU mvuorovy T vom TTC on vaca Novorov Enter the average return and standard deviation for a pl into a spreadsheet.) Portfolio Weights WABC WB Portfolio All = 17.78% 1.0 0.0 Year 2005 2006 2007 2008 2009 2010 2011 2012 2013 2014 2015 2016 2017 ABC Returns -5.6% 2.3% - 31.6% - 10.3% 31.6% 25.9% 22.6% 52.2% 35.8% 30.7% 27.1% 5.3% 45.2% B Returns 16.9% - 6.1% - 26.6% -3.8% 9.6% 8.5% 5.3% 41.6% 40.6% 39.6% 12.8% -0.4% 25.4% Help me solve this Etext pages AS Clear all Check answer Print Done