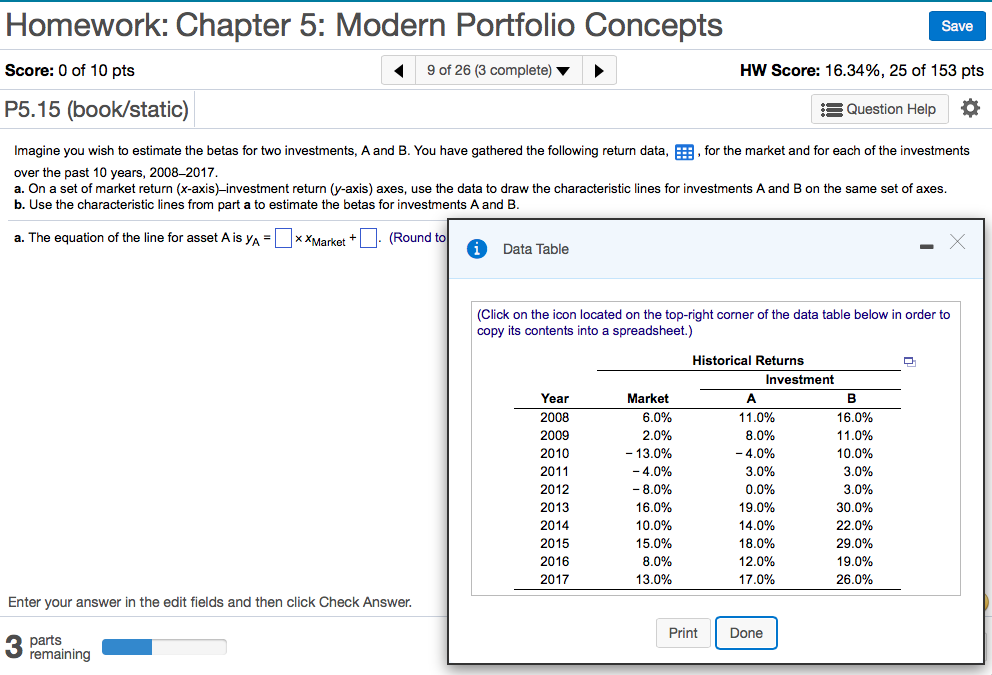
Homework: Chapter 5: Modern Portfolio Concepts Save Score: 0 of 10 pts 9 of 26 (3 complete) Hw score: 16.34%, 25 of 153 pts P5.15 (book/static) Question Help Imagine you wish to estimate the betas for two investments, A and B. You have gathered the following return data,, for the market and for each of the investments over the past 10 years, 2008-2017 a. On a set of market return (x-axis)-investment return (y-axis) axes, use the data to draw the characteristic lines for investments A and B on the same set of axes b. Use the characteristic lines from part a to estimate the betas for investments A and B a. The equation of the line for asset A is yAarket + (Round 1Data Table (Click on the icon located on the top-right corner of the data table below in order to copy its contents into a spreadsheet.) Historical Returns Investment Year 2008 2009 2010 2011 2012 2013 2014 2015 2016 2017 Market 6.0% 20% -13.0% -40%. -8.0% 16.0% 10.0% 15.0% 8.0% 13.0% 11.0% 8.0% -40%. 3.0% 16.0% 11.0% 10.0% 3.0% 3.0% 30.0% 22.0% 29.0% 19.0% 260% 19.0% 14.0% 18.0% 12.0% 17.0% Enter your answer in the edit fields and then click Check Answer Print Done parts remaining Homework: Chapter 5: Modern Portfolio Concepts Save Score: 0 of 10 pts 9 of 26 (3 complete) Hw score: 16.34%, 25 of 153 pts P5.15 (book/static) Question Help Imagine you wish to estimate the betas for two investments, A and B. You have gathered the following return data,, for the market and for each of the investments over the past 10 years, 2008-2017 a. On a set of market return (x-axis)-investment return (y-axis) axes, use the data to draw the characteristic lines for investments A and B on the same set of axes b. Use the characteristic lines from part a to estimate the betas for investments A and B a. The equation of the line for asset A is yAarket + (Round 1Data Table (Click on the icon located on the top-right corner of the data table below in order to copy its contents into a spreadsheet.) Historical Returns Investment Year 2008 2009 2010 2011 2012 2013 2014 2015 2016 2017 Market 6.0% 20% -13.0% -40%. -8.0% 16.0% 10.0% 15.0% 8.0% 13.0% 11.0% 8.0% -40%. 3.0% 16.0% 11.0% 10.0% 3.0% 3.0% 30.0% 22.0% 29.0% 19.0% 260% 19.0% 14.0% 18.0% 12.0% 17.0% Enter your answer in the edit fields and then click Check Answer Print Done parts remaining


