

The boxplot shows the poverty rates (the proportion of the population below the government's official poverty level) in all states of a certain country.
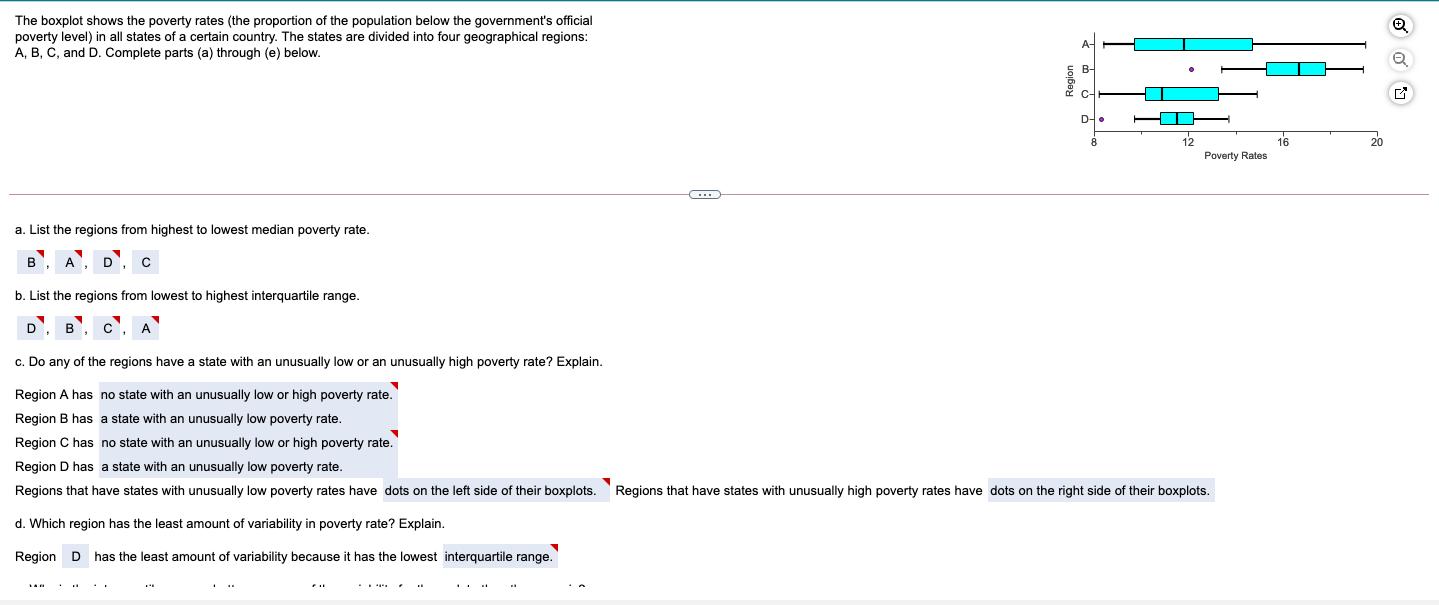
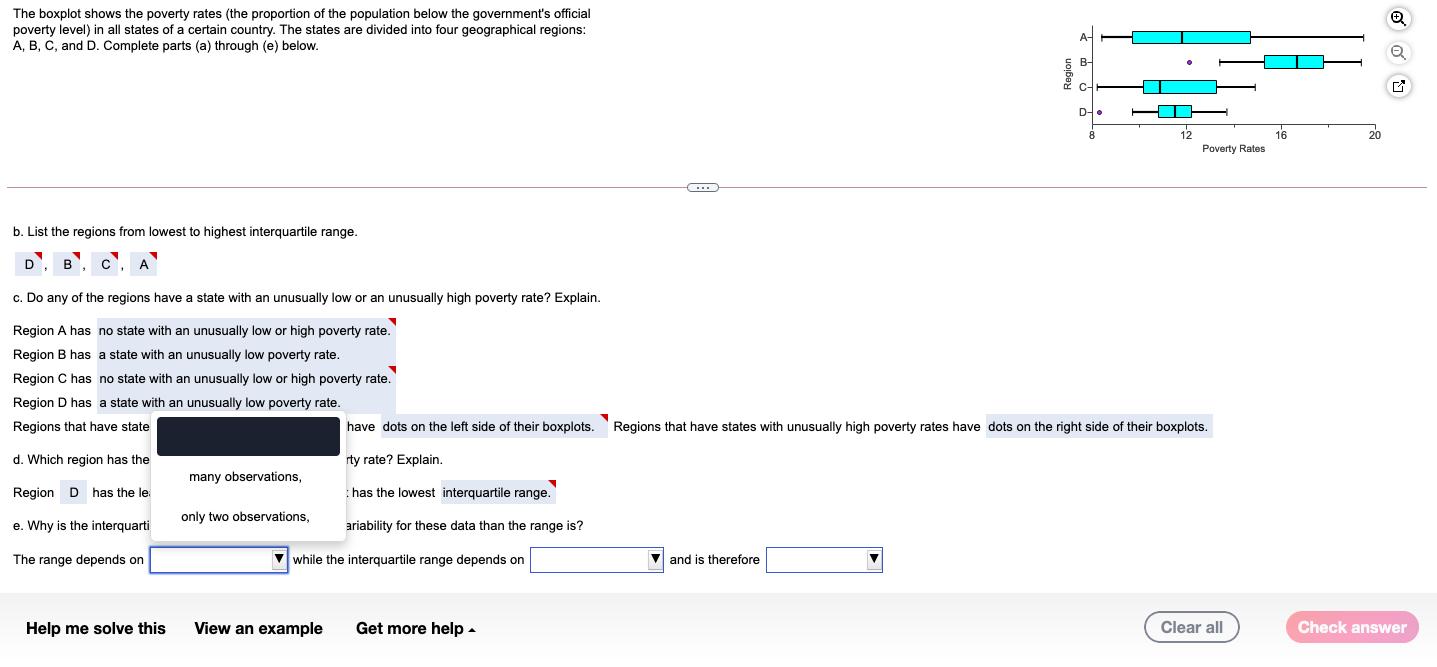
The boxplot shows the poverty rates (the proportion of the population below the government's official poverty level) in all states of a certain country. The states are divided into four geographical regions: A, B, C, and D. Complete parts (a) through (e) below. a. List the regions from highest to lowest median poverty rate. B. A, D, C b. List the regions from lowest to highest interquartile range. D. B. C. A c. Do any of the regions have a state with an unusually low or an unusually high poverty rate? Explain. Region A has no state with an unusually low or high poverty rate. Region B has a state with an unusually low poverty rate. D- 8 12 16 20 Poverty Rates Region C has no state with an unusually low or high poverty rate. Region D has a state with an unusually low poverty rate. Regions that have states with unusually low poverty rates have dots on the left side of their boxplots. Regions that have states with unusually high poverty rates have dots on the right side of their boxplots. d. Which region has the least amount of variability in poverty rate? Explain. Region D has the least amount of variability because it has the lowest interquartile range. Q The boxplot shows the poverty rates (the proportion of the population below the government's official poverty level) in all states of a certain country. The states are divided into four geographical regions: A, B, C, and D. Complete parts (a) through (e) below. D- 8 12 16 20 Poverty Rates b. List the regions from lowest to highest interquartile range. D. B. C. A c. Do any of the regions have a state with an unusually low or an unusually high poverty rate? Explain. Region A has no state with an unusually low or high poverty rate. Region B has a state with an unusually low poverty rate. Region C has no state with an unusually low or high poverty rate. Region D has a state with an unusually low poverty rate. Regions that have state d. Which region has the Region D has the le have dots on the left side of their boxplots. Regions that have states with unusually high poverty rates have dots on the right side of their boxplots. rty rate? Explain. has the lowest interquartile range. many observations, only two observations, e. Why is the interquarti The range depends on ariability for these data than the range is? while the interquartile range depends on and is therefore Help me solve this View an example Get more help - Clear all Check answer
Step by Step Solution
There are 3 Steps involved in it
Step: 1
Lets start by providing all the solutions stepbystep Part a List the regions from highest to lowest median poverty rate The median of the boxplot is r...
See step-by-step solutions with expert insights and AI powered tools for academic success
Step: 2

Step: 3
Ace Your Homework with AI
Get the answers you need in no time with our AI-driven, step-by-step assistance
Get Started
Authors: Carlos S Kubrusly
1st Edition
3319225065, 9783319225067