

Question
Homework help Controlling - Evaluation Please 1. Get the last 2 annual financial statement and discuss profitability trends (sales, gross profit, net profit). Include a
Homework help
Controlling - Evaluation
Please
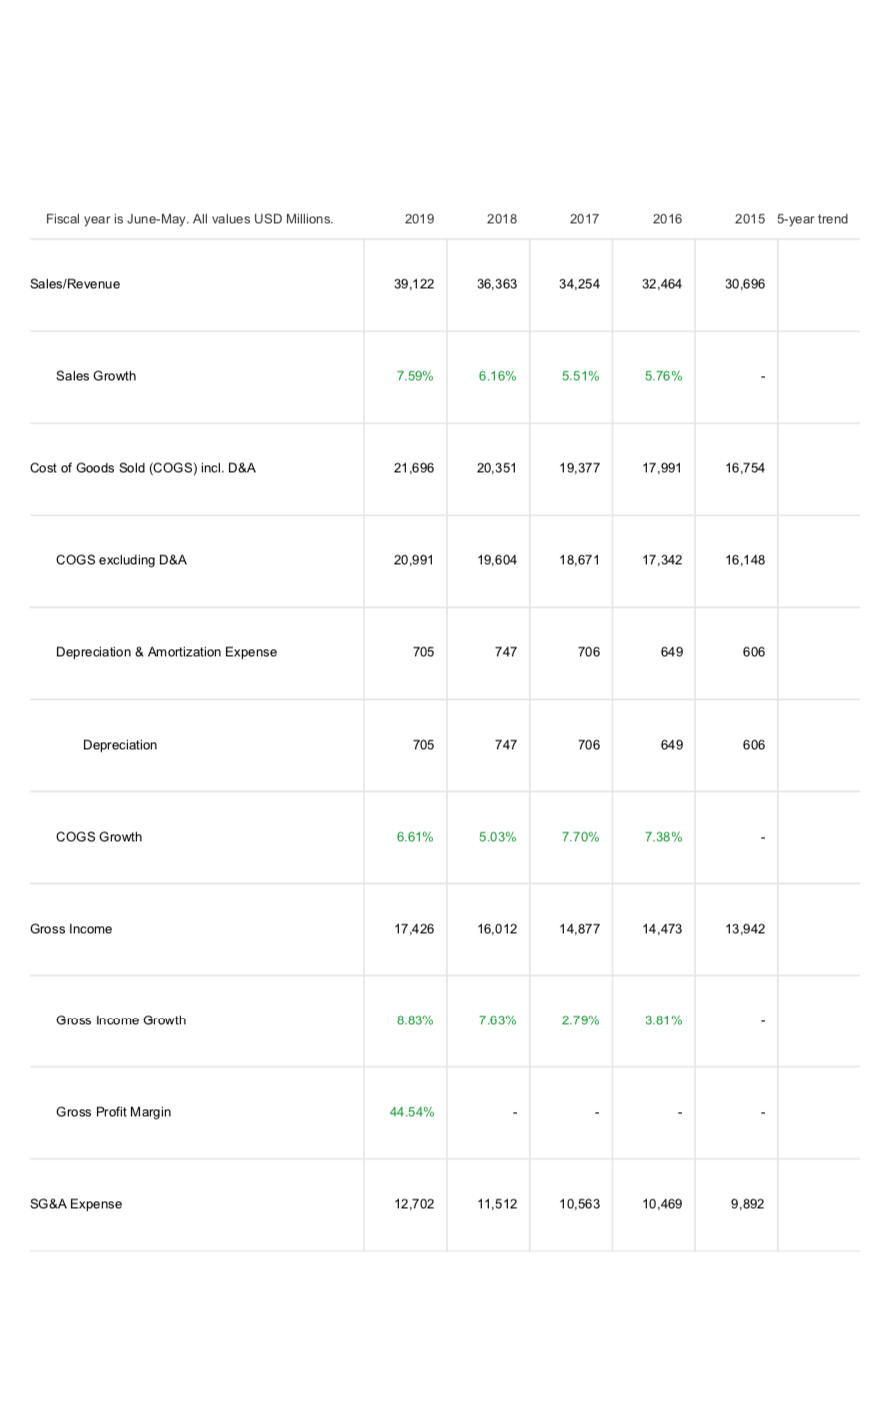
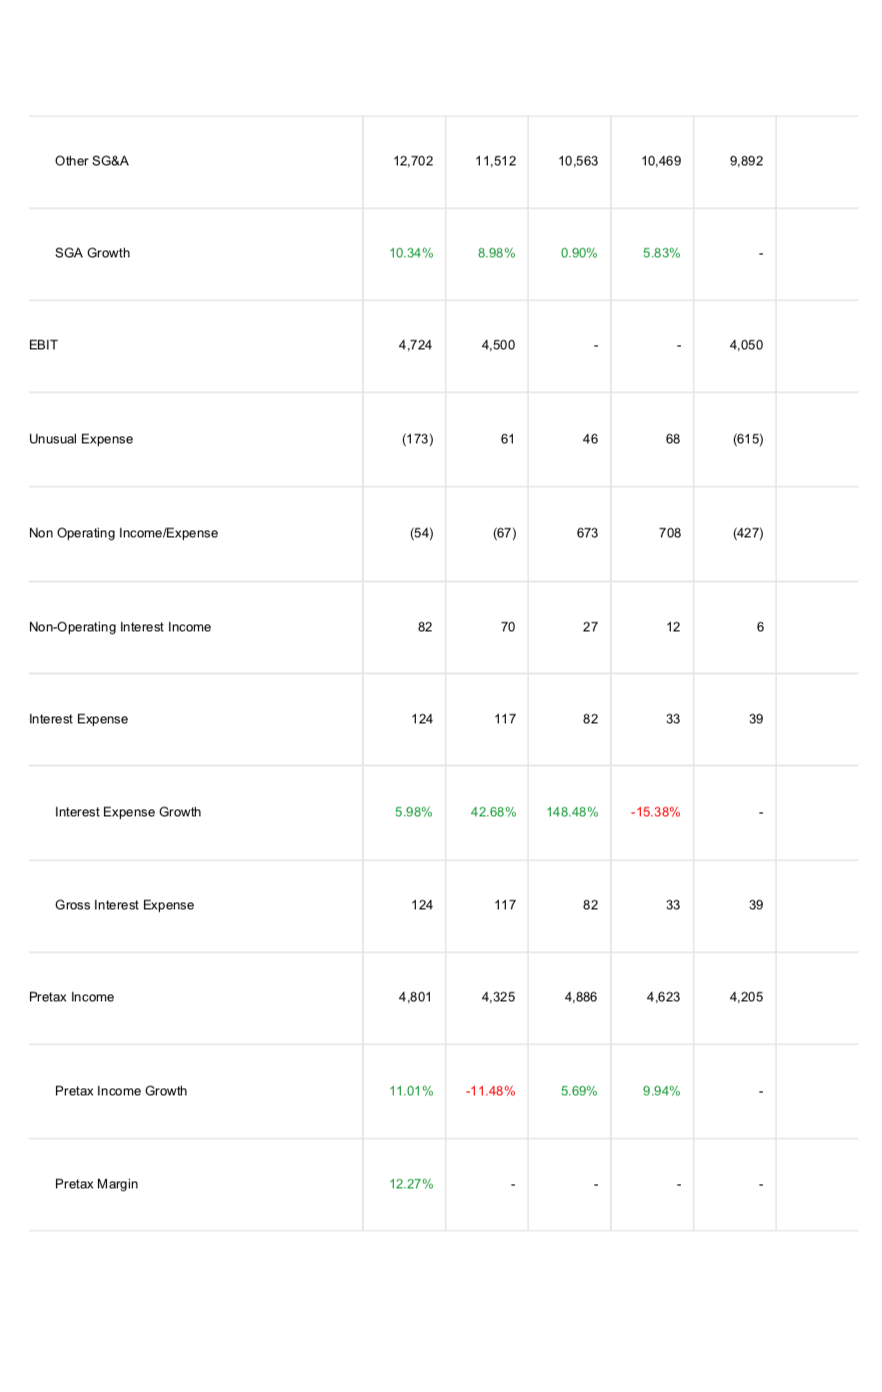
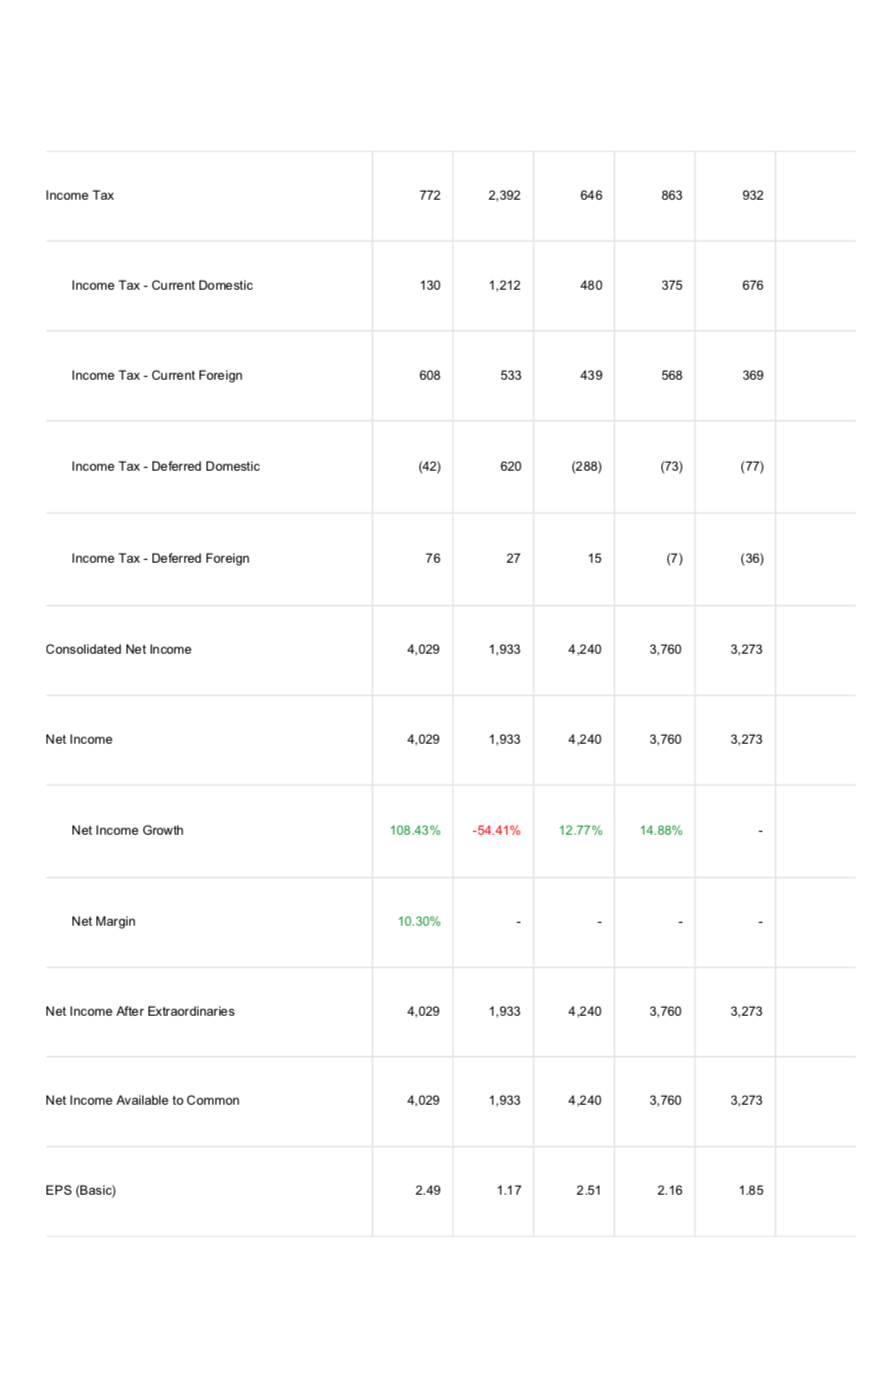
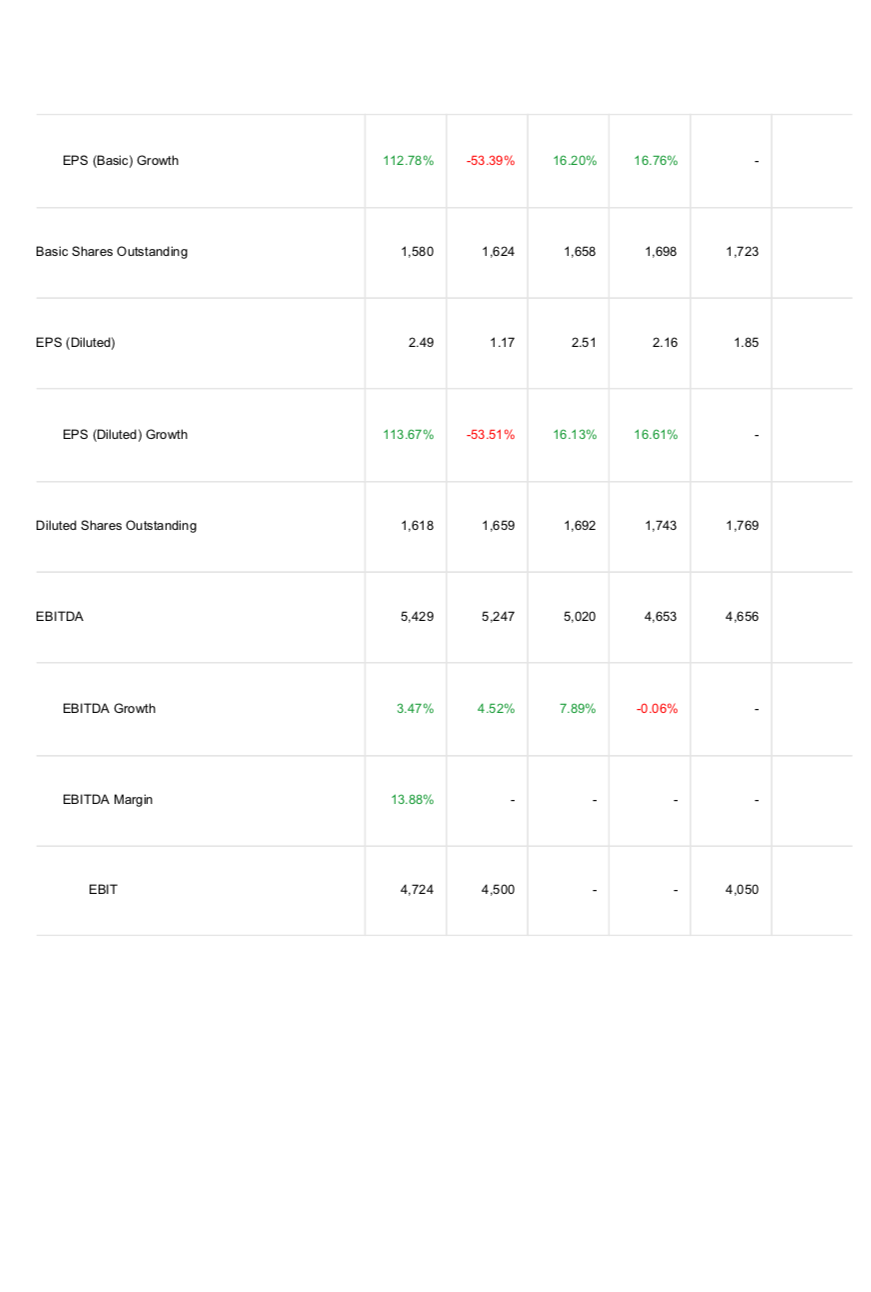
1. Get the last 2 annual financial statement and discuss profitability
trends (sales, gross profit, net profit). Include a copy of each page
used in an appendix.
2. Calculate 3 liquidity ratios, Debt to Equity Ratio, GP Ratio, and
Net Profit ratio for three consecutive years, show graphically and discuss trends and insights.
Step by Step Solution
There are 3 Steps involved in it
Step: 1

Get Instant Access to Expert-Tailored Solutions
See step-by-step solutions with expert insights and AI powered tools for academic success
Step: 2

Step: 3
Ace Your Homework with AI
Get the answers you need in no time with our AI-driven, step-by-step assistance
Get Started
Project Management A Systems Approach to Planning Scheduling and Controlling
Authors: Harold Kerzner
10th Edition
978-047027870, 978-0-470-5038, 470278706, 978-0470278703