Homework questions:-
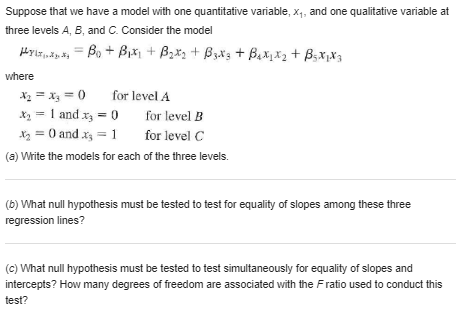
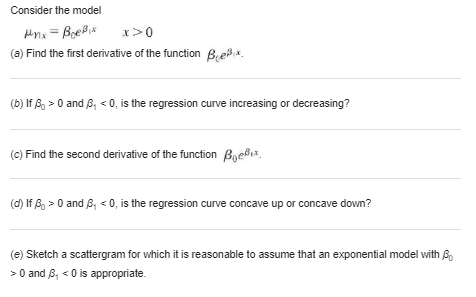
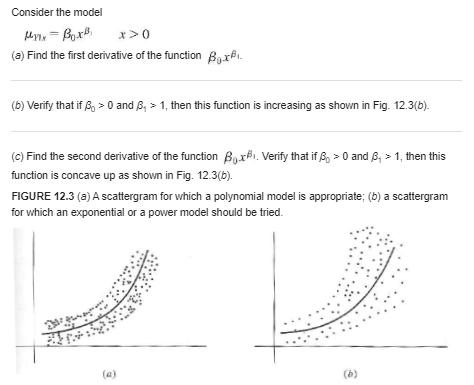
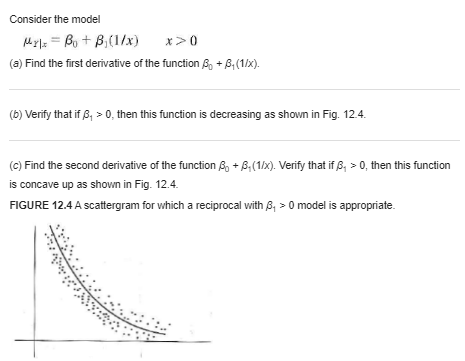
Suppose that we have a model with one quantitative variable, x,, and one qualitative variable at three levels A, 8, and C. Consider the model where *=x =0 for level A * = 1 and x, = 0 for level B 1 = 0 and r, = 1 for level C (a) Write the models for each of the three levels. (b) What null hypothesis must be tested to test for equality of slopes among these three regression lines? (c) What null hypothesis must be tested to test simultaneously for equality of slopes and intercepts? How many degrees of freedom are associated with the Fratio used to conduct this test?Consider the model (a) Find the first derivative of the function Brepix. (b) If & > 0 and B, 0 and B, 0 and 8, 0; with 8, 0 and B. > 1, then this function is increasing as shown in Fig. 12.3(b). (c) Find the second derivative of the function Box . Verify that if 6, > 0 and B, > 1, then this function is concave up as shown in Fig. 12.3(b). FIGURE 12.3 (a) A scattergram for which a polynomial model is appropriate; (b) a scattergram for which an exponential or a power model should be tried. (a) (b)Consider the power model with 8, > 0 and 0 0 and 6, 0, then this function is decreasing as shown in Fig. 12.4. (c) Find the second derivative of the function S + 8, (1/x). Verify that if 8, > 0, then this function is concave up as shown in Fig. 12.4. FIGURE 12.4 A scattergram for which a reciprocal with 6, > 0 model is appropriate.Verify that if , >0, then this function is concave up. If , >0, then the function > 0, because, if / > 0 then slope is positive, which means the r function will be positive. Therefore, the function is concave up.A study was conducted on the effect of water temperature and time in solution on the amount of dye absorbed by a certain kind of fabric. A standard amount of dye (200 milligrams/mg) was added to a fixed amount of water. The three temperature levels used in the experiment were 105, 120, and 135' C. The fabric was left in the water 15, 30, or 60 minutes (min). For each of these temperature-time combinations the amount of dye left inside the fabric was measured. The experiment yielded the following data: Dye in yarn (mg) Time in solution (min) Temperature of H,O(C) (v) 136 15 105 153 30 105 186 60 105 182 120 175 120 187 120 170 135 179 135 183 135 Graph y versus x, and y versus x2- Does there appear to be a relationship between time and/or temperature with the amount of dye left in fabric?A study was conducted on the effect of water temperature and time in solution on the amount of dye absorbed by a certain kind of fabric. A standard amount of dye (200 milligrams/mg) was added to a fixed amount of water. The three temperature levels used in the experiment were 105, 120, and 135" C. The fabric was left in the water 15, 30, or 60 minutes (min). For each of these temperature-time combinations the amount of dye left inside the fabric was measured. The experiment yielded the following data: Dye in yarn (mg) Time in solution (min) Temperature of H,O(C) (v) ( x, ) 136 15 105 153 30 105 186 60 105 182 120 175 120 187 120 170 135 179 30 135 183 50 135 Estimate the curve of regression of Y on X1
