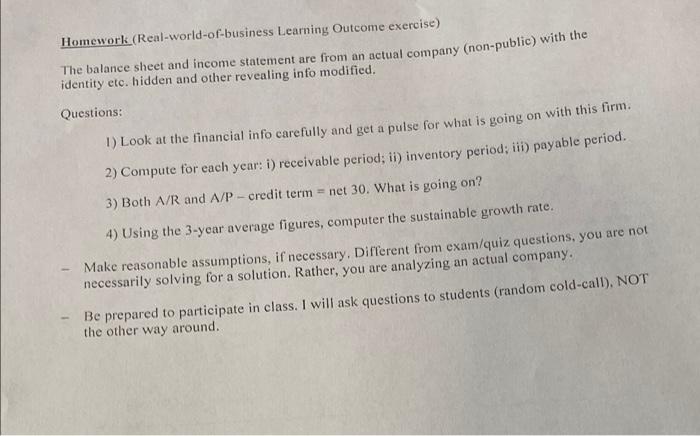
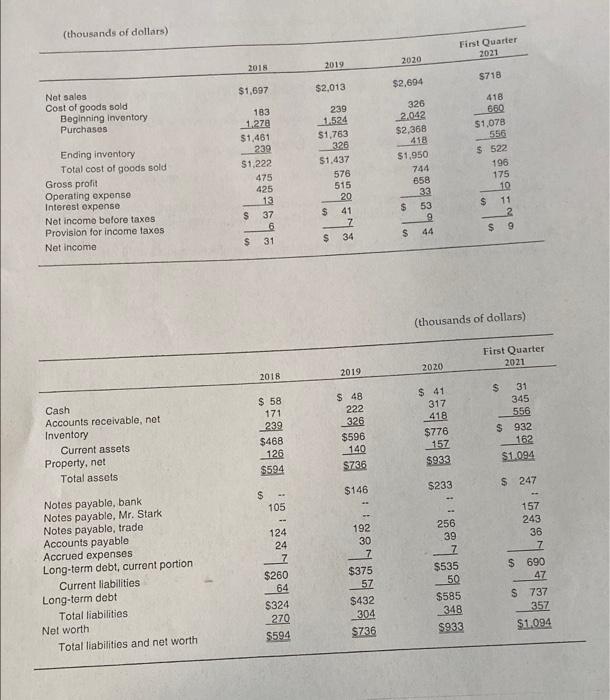
Homework (Real-world-of-business Learning Outcome exercise) The balance sheet and income statement are from an actual company (non-public) with the identity etc. hidden and other revealing info modified. Questions: 1) Look at the financial info carefully and get a pulse for what is going on with this firm. 2) Compute for each year: 1) receivable period; it) inventory period: ii) payable period. 3) Both A/R and A/P - credit term = net 30. What is going on? 4) Using the 3-year average figures, computer the sustainable growth rate. Make reasonable assumptions, if necessary. Different from exam/quiz questions, you are not necessarily solving for a solution. Rather, you are analyzing an actual company. Be prepared to participate in class. I will ask questions to students (random cold-call), NOT the other way around. (thousands of dollars) First Quarter 2021 2018 2019 2020 $718 $1,697 $2,013 $2,694 Net sales Cost of goods sold Beginning inventory Purchases Ending inventory Total cost of goods sold Gross profit Operating expense Interest expense Not income before taxes Provision for income taxes Net income 183 1.278 $1,481 239 $1,222 475 425 13 $ 37 6 $ 31 239 1.524 $1,763 326 51,437 576 515 20 $ 41 7 $ 34 326 2.042 $2,368 418 $1,950 744 658 33 S 53 9 $ 44 418 6.60 $1,078 556 $ 522 196 175 10 $ 11 2 $ 9 (thousands of dollars) First Quarter 2021 2020 2018 2019 Cash Accounts receivable, not Inventory Current assets Property, net Total assets $ 58 171 239 $468 126 $594 $ 48 222 326 $596 140 $73,6 $ 41 317 418 $776 157 $933 $ 31 345 556 $ 932 162 $1.094 $146 $233 $ 247 S 105 Notes payable, bank Notes payable, Mr. Stark Notes payable, trade Accounts payable Accrued expenses Long-term debt, current portion Current liabilities Long-term debt Total liabilities Net worth Total liabilities and net worth 157 243 36 7 $ 690 47 124 24 7 $260 64 $324 270 9594 256 39 7 $535 50 $585 348 $933 192 30 17 $375 57 $432 304 $736 S 737 357 $1094 Homework (Real-world-of-business Learning Outcome exercise) The balance sheet and income statement are from an actual company (non-public) with the identity etc. hidden and other revealing info modified. Questions: 1) Look at the financial info carefully and get a pulse for what is going on with this firm. 2) Compute for each year: 1) receivable period; it) inventory period: ii) payable period. 3) Both A/R and A/P - credit term = net 30. What is going on? 4) Using the 3-year average figures, computer the sustainable growth rate. Make reasonable assumptions, if necessary. Different from exam/quiz questions, you are not necessarily solving for a solution. Rather, you are analyzing an actual company. Be prepared to participate in class. I will ask questions to students (random cold-call), NOT the other way around. (thousands of dollars) First Quarter 2021 2018 2019 2020 $718 $1,697 $2,013 $2,694 Net sales Cost of goods sold Beginning inventory Purchases Ending inventory Total cost of goods sold Gross profit Operating expense Interest expense Not income before taxes Provision for income taxes Net income 183 1.278 $1,481 239 $1,222 475 425 13 $ 37 6 $ 31 239 1.524 $1,763 326 51,437 576 515 20 $ 41 7 $ 34 326 2.042 $2,368 418 $1,950 744 658 33 S 53 9 $ 44 418 6.60 $1,078 556 $ 522 196 175 10 $ 11 2 $ 9 (thousands of dollars) First Quarter 2021 2020 2018 2019 Cash Accounts receivable, not Inventory Current assets Property, net Total assets $ 58 171 239 $468 126 $594 $ 48 222 326 $596 140 $73,6 $ 41 317 418 $776 157 $933 $ 31 345 556 $ 932 162 $1.094 $146 $233 $ 247 S 105 Notes payable, bank Notes payable, Mr. Stark Notes payable, trade Accounts payable Accrued expenses Long-term debt, current portion Current liabilities Long-term debt Total liabilities Net worth Total liabilities and net worth 157 243 36 7 $ 690 47 124 24 7 $260 64 $324 270 9594 256 39 7 $535 50 $585 348 $933 192 30 17 $375 57 $432 304 $736 S 737 357 $1094


