

Answered step by step
Verified Expert Solution
Question
1 Approved Answer
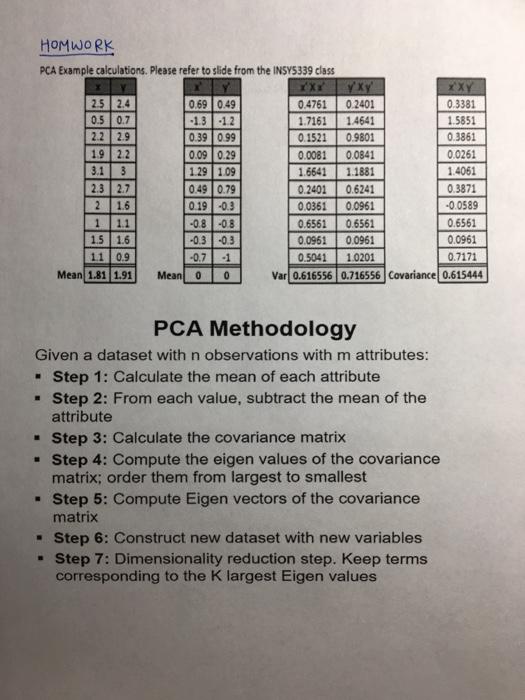
HOMWORK PCA Example calculations. Please refer to slide from the INSY5339 class y XXY 2.5 2.4 0.69 0.49 0.4761 0.2401 0.3381 0.5 0.7 -13-12 1.7161
Step by Step Solution
There are 3 Steps involved in it
Step: 1

Get Instant Access to Expert-Tailored Solutions
See step-by-step solutions with expert insights and AI powered tools for academic success
Step: 2

Step: 3
Ace Your Homework with AI
Get the answers you need in no time with our AI-driven, step-by-step assistance
Get Started
Conceptual Database Design An Entity Relationship Approach
Authors: Carol Batini, Stefano Ceri, Shamkant B. Navathe
1st Edition
0805302441, 978-0805302448