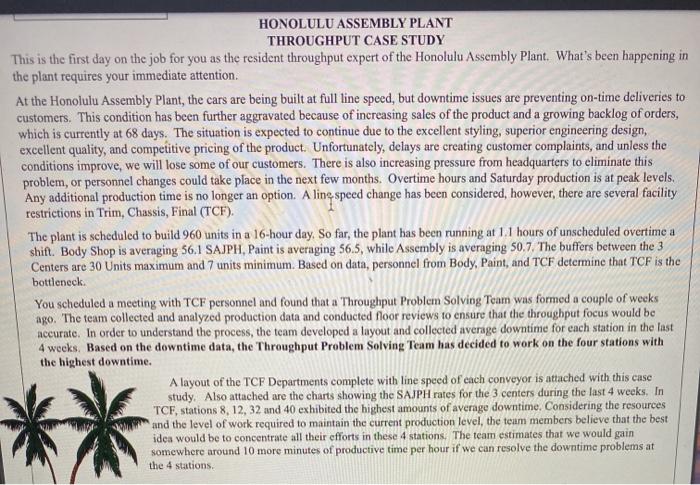
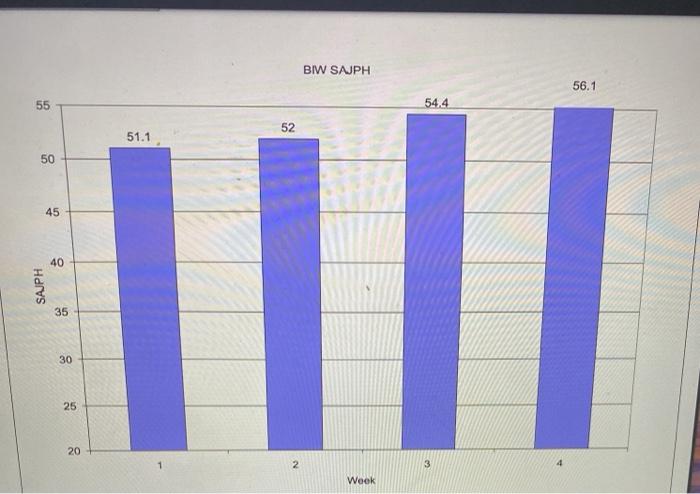
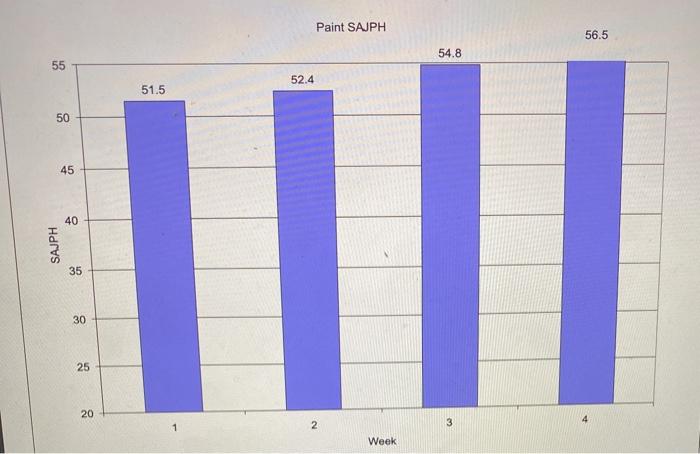
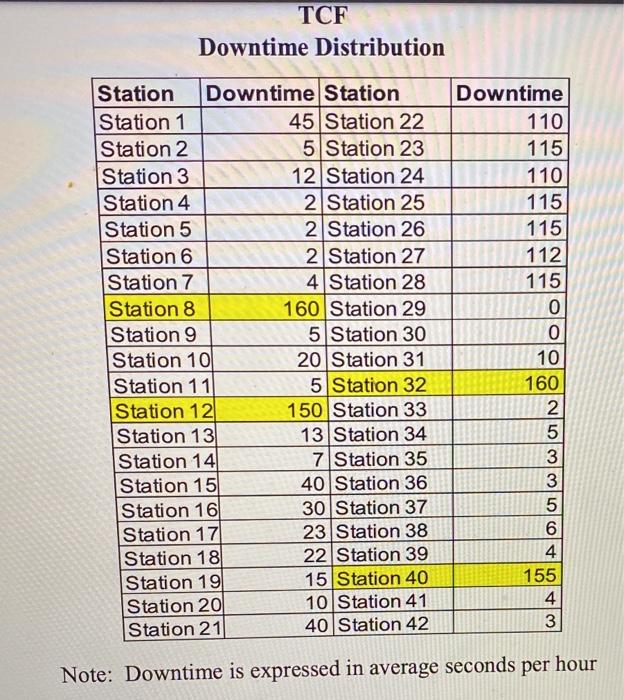
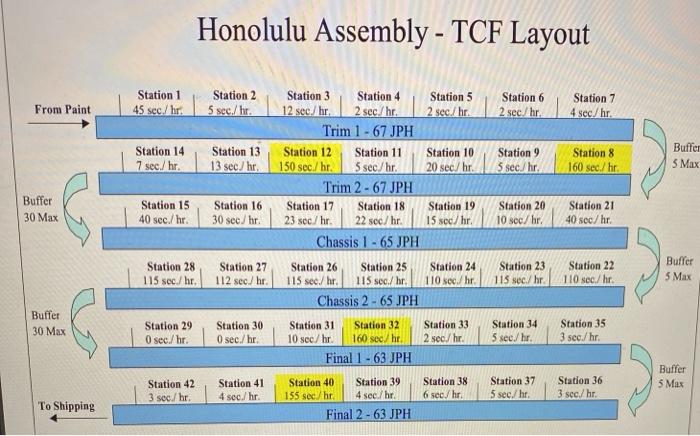
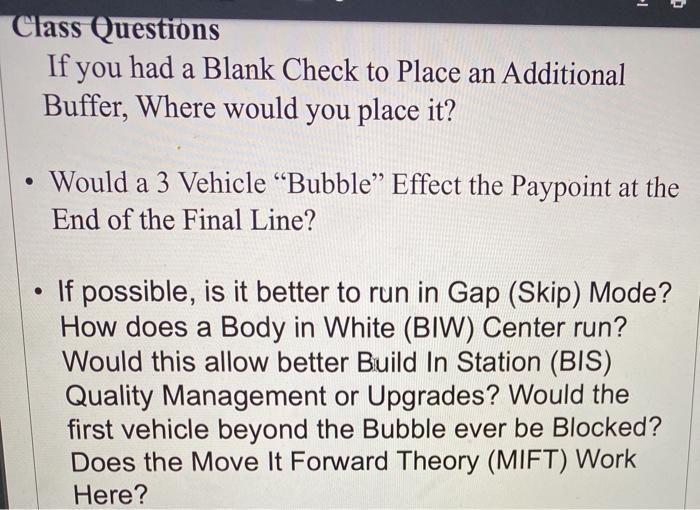
HONOLULU ASSEMBLY PLANT THROUGHPUT CASE STUDY This is the first day on the job for you as the resident throughput expert of the Honolulu Assembly Plant. What's been happening in the plant requires your immediate attention. At the Honolulu Assembly Plant, the cars are being built at full line speed, but downtime issues are preventing on-time deliveries to customers. This condition has been further aggravated because of increasing sales of the product and a growing backlog of orders, which is currently at 68 days. The situation is expected to continue due to the excellent styling, superior engineering design, excellent quality, and competitive pricing of the product. Unfortunately, delays are creating customer complaints, and unless the conditions improve, we will lose some of our customers. There is also increasing pressure from headquarters to eliminate this problem, or personnel changes could take place in the next few months. Overtime hours and Saturday production is at peak levels. Any additional production time is no longer an option. A ling speed change has been considered, however, there are several facility restrictions in Trim, Chassis, Final (TCF). The plant is scheduled to build 960 units in a 16-hour day. So far, the plant has been running at 11 hours of unscheduled overtime a shift. Body Shop is averaging 56.1 SAJPH, Paint is averaging 56.5, while Assembly is averaging 50.7. The buffers between the 3 Centers are 30 Units maximum and 7 units minimum. Based on data, personnel from Body, Paint, and TCF determine that TCF is the bottleneck. You scheduled a meeting with TCF personnel and found that a "Throughput Problem Solving Team was formed a couple of weeks ago. The team collected and analyzed production data and conducted floor reviews to ensure that the throughput focus would be accurate. In order to understand the process, the team developed a layout and collected average downtime for each station in the last 4 weeks. Based on the downtime data, the Throughput Problem Solving Team has decided to work on the four stations with the highest downtime. A layout of the TCF Departments complete with line speed of each conveyor is attached with this case study. Also attached are the charts showing the SAJPH rates for the 3 centers during the last 4 weeks, In TCF, stations 8, 12, 32 and 40 exhibited the highest amounts of average downtime. Considering the resources and the level of work required to maintain the current production level, the team members believe that the best idea would be to concentrate all their efforts in these 4 stations. The team estimates that we would gain somewhere around 10 more minutes of productive time per hour if we can resolve the downtime problems at the 4 stations ** BIW SAJPH 56,1 55 54.4 52 51.1 50 45 40 SAJPH 35 30 25 20 2 3 Week Paint SAJPH 56.5 54.8 55 52.4 51.5 50 45 40 SAJPH 35 30 25 20 2 3 Week TCF SAJPH 55 50.7 50 49.2 46.8 45.9 45 40 SAJPH 35 il 30 25 20 2 3 Week TCF Downtime Distribution Station Downtime Station Station 1 45 Station 22 Station 2 5 Station 23 Station 3 12 Station 24 Station 4 2 Station 25 Station 5 2 Station 26 Station 6 2 Station 27 Station 7 4 Station 28 Station 8 160 Station 29 Station 9 5 Station 30 Station 10 20 Station 31 Station 11 5 Station 32 Station 12 150 Station 33 Station 131 13 Station 34 Station 14 7 Station 35 Station 15 40 Station 36 Station 161 30 Station 37 Station 17 23 Station 38 Station 18 22 Station 39 Station 19 15 Station 40 Station 20 10 Station 41 Station 21 40 Station 42 Downtime 110 115 110 115 115 112 115 0 0 10 160 2 WON 5 3 3 5 6 4 155 4 3 Note: Downtime is expressed in average seconds per hour Honolulu Assembly - TCF Layout From Paint Station 6 2 sec.hr Station 7 4 sec./hr. Station 9 5 sec/hr. Station 8 160 sec./hr. Buffer 5 Max Buffer 30 Max Station 20 10 sec/hr. Station 21 40 sec/hr Station 1 Station 2 Station 3 Station 4 Station 5 45 sec./hr. 5 sec./hr. 12 sec./hr. 2 sec/hr. 2 sec./hr. Trim 1 - 67 JPH Station 14 Station 13 Station 12 Station 11 Station 10 7 sec./hr. 13 sec/hr. 150 sec./hr. 5 sec/hr. 20 sec./hr. Trim 2 - 67 JPH Station 15 Station 16 Station 17 Station 18 Station 19 40 sec./hr. 30 sec/hr 23 sec/hr. 22 sec/hr. 15 sec/hr. Chassis 1 - 65 JPH Station 28 Station 27 Station 26 Station 25 Station 24 115 sec./hr. 112 sec hr. 115 sec./hr. 115 sec./hr. 110 soc./hr. Chassis 2 - 65 JPH Station 29 Station 30 Station 31 Station 32 Station 33 O sec./hr. O sec./hr. 10 sec/hr 160 sec.hr 2 sec/hr Final 1 - 63 JPH Station 42 Station 41 Station 40 Station 39 Station 38 3 sec./hr. 4 sec.hr 155 sec/hr. 4 sec./hr. 6 sec./hr. Final 2 - 63 JPH Station 23 115 sec./hr. Station 22 1 10 sec/hr Buffer 5 Max Buffer 30 Max Station 34 5 sec./hr. Station 35 3 seg./hr. Station 37 5 sec./hr. Station 36 3 sec./hr. Buffer 5 Max To Shipping 1- Class Questions If you had a Blank Check to Place an Additional Buffer, Where would you place it? Would a 3 Vehicle Bubble Effect the Paypoint at the End of the Final Line? If possible, is it better to run in Gap (Skip) Mode? How does a Body in White (BIW) Center run? Would this allow better Build In Station (BIS) Quality Management or Upgrades? Would the first vehicle beyond the Bubble ever be Blocked? Does the Move It Forward Theory (MIFT) Work Here? HONOLULU ASSEMBLY PLANT THROUGHPUT CASE STUDY This is the first day on the job for you as the resident throughput expert of the Honolulu Assembly Plant. What's been happening in the plant requires your immediate attention. At the Honolulu Assembly Plant, the cars are being built at full line speed, but downtime issues are preventing on-time deliveries to customers. This condition has been further aggravated because of increasing sales of the product and a growing backlog of orders, which is currently at 68 days. The situation is expected to continue due to the excellent styling, superior engineering design, excellent quality, and competitive pricing of the product. Unfortunately, delays are creating customer complaints, and unless the conditions improve, we will lose some of our customers. There is also increasing pressure from headquarters to eliminate this problem, or personnel changes could take place in the next few months. Overtime hours and Saturday production is at peak levels. Any additional production time is no longer an option. A ling speed change has been considered, however, there are several facility restrictions in Trim, Chassis, Final (TCF). The plant is scheduled to build 960 units in a 16-hour day. So far, the plant has been running at 11 hours of unscheduled overtime a shift. Body Shop is averaging 56.1 SAJPH, Paint is averaging 56.5, while Assembly is averaging 50.7. The buffers between the 3 Centers are 30 Units maximum and 7 units minimum. Based on data, personnel from Body, Paint, and TCF determine that TCF is the bottleneck. You scheduled a meeting with TCF personnel and found that a "Throughput Problem Solving Team was formed a couple of weeks ago. The team collected and analyzed production data and conducted floor reviews to ensure that the throughput focus would be accurate. In order to understand the process, the team developed a layout and collected average downtime for each station in the last 4 weeks. Based on the downtime data, the Throughput Problem Solving Team has decided to work on the four stations with the highest downtime. A layout of the TCF Departments complete with line speed of each conveyor is attached with this case study. Also attached are the charts showing the SAJPH rates for the 3 centers during the last 4 weeks, In TCF, stations 8, 12, 32 and 40 exhibited the highest amounts of average downtime. Considering the resources and the level of work required to maintain the current production level, the team members believe that the best idea would be to concentrate all their efforts in these 4 stations. The team estimates that we would gain somewhere around 10 more minutes of productive time per hour if we can resolve the downtime problems at the 4 stations ** BIW SAJPH 56,1 55 54.4 52 51.1 50 45 40 SAJPH 35 30 25 20 2 3 Week Paint SAJPH 56.5 54.8 55 52.4 51.5 50 45 40 SAJPH 35 30 25 20 2 3 Week TCF SAJPH 55 50.7 50 49.2 46.8 45.9 45 40 SAJPH 35 il 30 25 20 2 3 Week TCF Downtime Distribution Station Downtime Station Station 1 45 Station 22 Station 2 5 Station 23 Station 3 12 Station 24 Station 4 2 Station 25 Station 5 2 Station 26 Station 6 2 Station 27 Station 7 4 Station 28 Station 8 160 Station 29 Station 9 5 Station 30 Station 10 20 Station 31 Station 11 5 Station 32 Station 12 150 Station 33 Station 131 13 Station 34 Station 14 7 Station 35 Station 15 40 Station 36 Station 161 30 Station 37 Station 17 23 Station 38 Station 18 22 Station 39 Station 19 15 Station 40 Station 20 10 Station 41 Station 21 40 Station 42 Downtime 110 115 110 115 115 112 115 0 0 10 160 2 WON 5 3 3 5 6 4 155 4 3 Note: Downtime is expressed in average seconds per hour Honolulu Assembly - TCF Layout From Paint Station 6 2 sec.hr Station 7 4 sec./hr. Station 9 5 sec/hr. Station 8 160 sec./hr. Buffer 5 Max Buffer 30 Max Station 20 10 sec/hr. Station 21 40 sec/hr Station 1 Station 2 Station 3 Station 4 Station 5 45 sec./hr. 5 sec./hr. 12 sec./hr. 2 sec/hr. 2 sec./hr. Trim 1 - 67 JPH Station 14 Station 13 Station 12 Station 11 Station 10 7 sec./hr. 13 sec/hr. 150 sec./hr. 5 sec/hr. 20 sec./hr. Trim 2 - 67 JPH Station 15 Station 16 Station 17 Station 18 Station 19 40 sec./hr. 30 sec/hr 23 sec/hr. 22 sec/hr. 15 sec/hr. Chassis 1 - 65 JPH Station 28 Station 27 Station 26 Station 25 Station 24 115 sec./hr. 112 sec hr. 115 sec./hr. 115 sec./hr. 110 soc./hr. Chassis 2 - 65 JPH Station 29 Station 30 Station 31 Station 32 Station 33 O sec./hr. O sec./hr. 10 sec/hr 160 sec.hr 2 sec/hr Final 1 - 63 JPH Station 42 Station 41 Station 40 Station 39 Station 38 3 sec./hr. 4 sec.hr 155 sec/hr. 4 sec./hr. 6 sec./hr. Final 2 - 63 JPH Station 23 115 sec./hr. Station 22 1 10 sec/hr Buffer 5 Max Buffer 30 Max Station 34 5 sec./hr. Station 35 3 seg./hr. Station 37 5 sec./hr. Station 36 3 sec./hr. Buffer 5 Max To Shipping 1- Class Questions If you had a Blank Check to Place an Additional Buffer, Where would you place it? Would a 3 Vehicle Bubble Effect the Paypoint at the End of the Final Line? If possible, is it better to run in Gap (Skip) Mode? How does a Body in White (BIW) Center run? Would this allow better Build In Station (BIS) Quality Management or Upgrades? Would the first vehicle beyond the Bubble ever be Blocked? Does the Move It Forward Theory (MIFT) Work Here