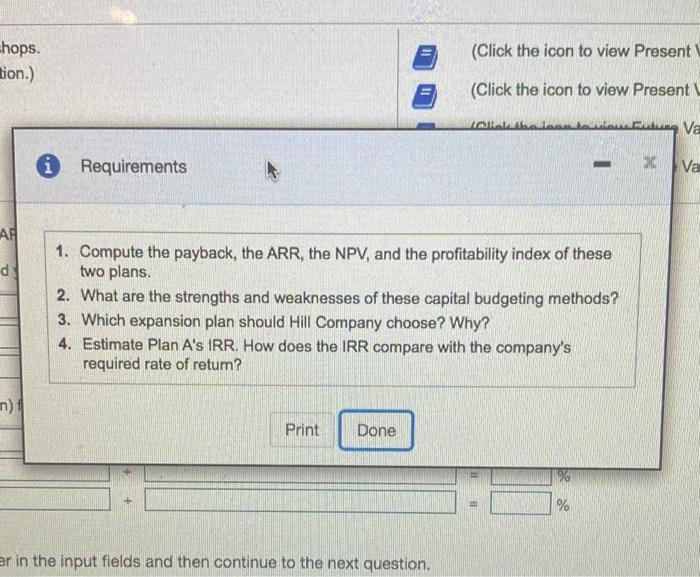
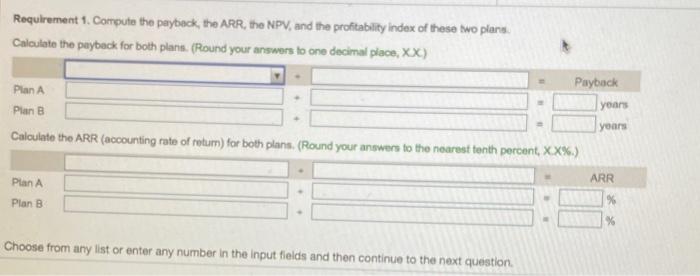
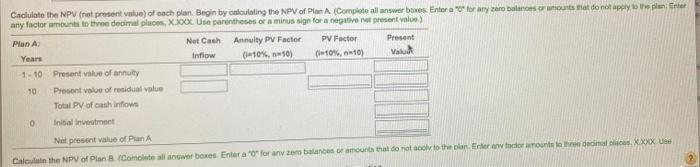
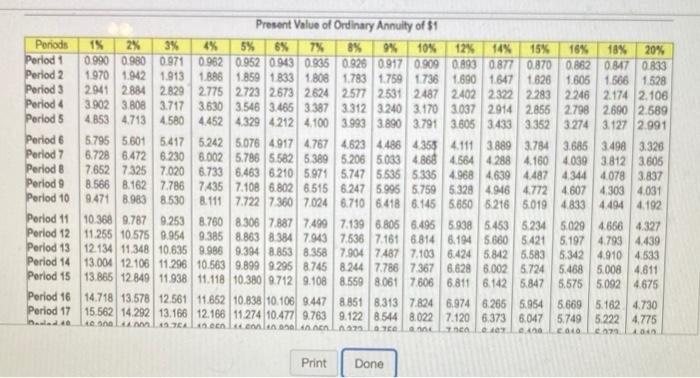
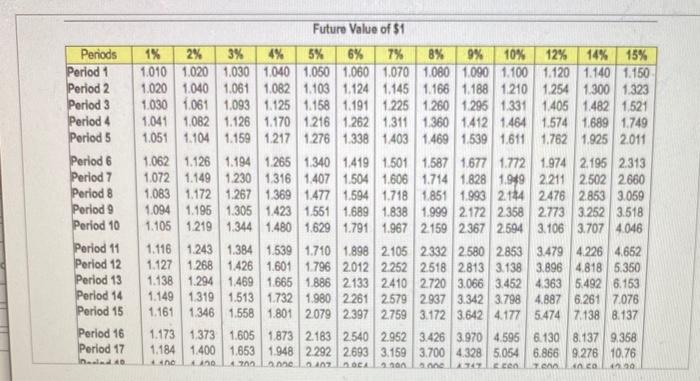
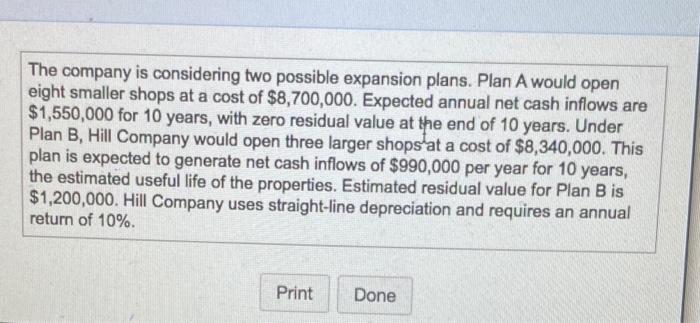
=hops. tion.) (Click the icon to view Present (Click the icon to view Present ANAL RWVa i Requirements 2 Va AR d 1. Compute the payback, the ARR, the NPV, and the profitability index of these two plans. 2. What are the strengths and weaknesses of these capital budgeting methods? 3. Which expansion plan should Hill Company choose? Why? 4. Estimate Plan A's IRR. How does the IRR compare with the company's required rate of return? n) Print Done % er in the input fields and then continue to the next question. Requirement 1. Compute the payback, the ARR, the NPV, and the profitability index of these two plans Calculate the payback for both plans. (Round your answers to one decimal place, XX) Payback Plan A Plan B yoans your Calculate the ARR (accounting rate of retum) for both plans. (Round your answers to the nearest tenth percent, XX%.) Plan A ARR Plan B % Choose from any list or enter any number in the input fields and then continue to the next question Caciulate the NPV (rast present Value) of each plan. Begin by calculating the NPV of Plan A (Complete all answer boxes Enter for any zero balonces counts to do not apply to the planner any factor amount to the decimal places. XX. se parents or a minus sign for a negativne presental) Plan A: Net Cash Annuity PU Factor PV Factor Present Years Inflow (10%, 10) (10%, 10) Value 1-10 Present value of annuity 10 Procent value of residual value Total PV of cash flow 0 Inibal intent Net present value of Plan A Calculate the NPV of Plan B Complete all now boxes. Enter for anyone or amounts that do not col to the plannen onts to the decades. xxxx Present Value of $1 Periods 15 2% 3% 5% 6% 7% 8% 9% 10% 12% 14% 15% 16% 18% 20% Period 1 0.990 0.980 0,971 0.962 0.952 0.943 0.935 0.926 0.917 0.909 0.893 0.877 0.870 0 862 0.847 0.833 Period 2 0.980 0.961 0.943 0.925 0.907 0.890 0.8730.857 0.842 0.826 0.797 0.759 0.750 0.743 0718 0.694 Period 3 0.971 0.942 0915 0.889 0.864 0.840 0.816 0.794 0.772 0.751 07120.675 0.658 0.641 0.609 0579 Period 4 0.961 0.924 0.888 0.855 0.823 0.792 0.763 0.735 0708 0.683 0636 0.592 0.572 0552 0.516 0.482 Period 5 0.951 0.006 0.863 0.822 0.784 0.747 0.713 0.681 0.650 0.621 0.567 0.519 0497 0.476 0.437 0.402 Period 0.942 0.888 0.837 0.790 0.746 0.705 0.666 0.630 0.506 0.564 0.507 0.456 0.432 0.410 0.370 0.335 Period 7 0.933 0.871 0.313 0.750 0.7110.665 0.623 0.583 0.547 0.513 0.452 0.400 0.378 0.354 0.3140.279 Period 8 0.923 0.853 0.789 0.731 0.6770627 0.582 0.540 0.502 0.467 0.404 0.351 0.327 0.305 0.266 0.233 Period 9 0.914 0.8370.766 0.703 0.645 0.5920.544 0.500 0.460 0.4240361 0.308 0.284 0263 0.225 0.194 Period 10 0.905 0.820 0.744 0.676 0.614 0.558 0.508 0463 0422 0.386 0322 0.270 0.247 0.227 0.191 0.162 Period 11 0.896 0.8040.722 0.650 0.585 0.527 0.475 0.429 0.388 0.3500 287 0.237 0.215 0.195 0.162 0.135 Period 12 0.587 0.788 0.701 0.625 0.5570497 0.4440.397 0.356 0.319 0257 0.208 0.187 0.168 0.137 0.112 Period 13 0.879 0.773 0.681 0.601 0.530 0.469 0.415 0.368 0.326 0.290 0229 0.182 0.163 0.145 0.116 0.093 Period 14 0.870 0.758 0.661 0.577 0.505 0.442 0.388 0.340 0.299 0.263 0.205 0.1600.141 0.125 0.099 0.078 Period 15 0.861 0.743 0.642 0.555 0.481 0.417 0.362 0.315 0.275 0.299 0.183 0.140 0.123 0.108 0.084 0.066 Period 16 0.853 0.728 0.623 0.534 0.458 0.394 0.339 0292 0.252 0.218 0.163 0.123 0.107 0.093 0.071 0.054 Period 17 0.844 0.714 0.605 0.513 0.436 0.371 0.317 0.270 0231 0.198 0.146 0.108 0.093 0.080 0.060 0.045 ned LA LA AAN Ale A LA A ACA A ACO A AME A 14 Present Value of Ordinary Annuity of $1 Periods 15 2% 3% 4% 5% 6% 7% 8% 9% 10% 12% 14 15% 16% 18% 20% Period 1 0.990 0.980 0.971 0.962 0.952 0.943 0.035 0.926 0917 0.909 0.893 0.877 0.870 0.862 0.847 0.833 Period 2 1970 1.942 1.913 1886 1859 1833 1808 1.783 1759 1736 1.690 1647 1626 1.605 1666 1528 Period 3 2941 2884 2829 2775 2.723 2673 2624 2577 2531 2.487 24022 322 2283 2246 2174 2.106 Period 4 3.902 3.808 3.717 3.630 3.546 3.466 3.387 3.312 3240 3.170 3037 2914 2.855 2798 2690 2.589 Periods 4853 4.713 4580 4.452 43294212 4.100 3.993 3.890 3.791 3.6053433 3352 32743.127 2.991 Period 6 5.795 5601 5.417 5.242 5.076 49174767 4.623 4486 4359 4.111 3889 3784 3.686 3.498 3.326 Period 7 6.728 6.472 8230 8.002 5.786 5582 53895206 5033 4.868 4.564 4.288 4.160 4.039 3.812 3.605 Period 8 7.6527325 7020 6.733 6.4636210 5.97457475.536 5335 49684.639 4.487 4,344 4.078 3.837 Period 9 8.566 8.1627.786 7435 7.108 6.802 6515 6.247 5.995 5.759 5328 4.946 47724.607 4303 4031 Period 10 9.471 8983 8.530 8.1117.722736070246.710 6418 6.145 5.650 6216 5.019 4833 4494 4.192 Period 11 10.368 9.787 9.253 8.760 8.30678877499 7.139 6.805 6.496 5.938 5.453 5234 5029 4666 4.327 Period 12 11.255 10.575 8.954 9.385 8.86383847,943 7.636 7.161 6814 6.194 56805421 5197 4.793 4.439 Period 13 12.134 11.348 10.6359.986 9.3948.853 8.358 7.9047.487 7.103 6.424 5.842 5.583 5.342 4.910 4.533 Period 14 13.004 12.106 11.29610.563 9.899 9.295 8.745 8.244 7.78673676.628 6.002 5.724 5.468 5.008 4.611 Period 15 13.866 12 849 11.938 11.118 10,380 0.712 9.108 8.559 8061 7,606 6.811 6.142 5.847 5.575 5.092 4.675 Period 16 14.718 13.578 12.561 11.652 10.838 10.106 8.447 8.851 8.31378246.974 6.265 5.954 5.669 5.162 4.730 Period 17 15,562 14.292 13.166 12.166 11274 10.4771 9.763 9.122 8.544 8.022 7.120 6.373 6.047 5.749 5.222 4.775 balado olcalleen een in all TA . 016 10 Print Done Periods Period 1 Period 2 Period 3 Period 4 Period 5 Period 6 Period 7 Period 8 Period 9 Period 10 Period 11 Period 12 Period 13 Period 14 Period 15 Period 16 Period 17 ned Future Value of 51 1% 2% 3% 4% 5% 6% 7% 8% 9% 10% 12% 14% 15% 1.010 1.020 1.030 1040 1.050 1.060 1.070 1080 1.090 1.100 1.120 1.140 1.150 1.020 1.040 1.061 1.082 1.103 1.124 1.145 1.168 1.188 1210 1.254 1.300 1.323 1.030 1061 1,093 1.125 1.158 1.191 1225 1260 1295 1.331 1.405 1.482 1521 1.041 1.082 1.126 1.170 1.216 1.262 1,311 1.360 1.4121.464 1.574 1689 1.749 1.051 1.104 1.159 1.217 1.276 1.338 1403 1.469 1.539 1.611 1.762 1.925 2.011 1.062 1.126 1.194 1.265 1.340 1.419 1.501 1.587 1.677 1.772 1.974 2.195 2.313 1.072 1.149 1.230 1316 1.407 1.504 1.606 1.7141.828 1.949 2211 2502 2.660 1.083 1.172 1.267 1.369 1.477 1,594 1.718 1.851 1.993 2184 2.476 2.853 3.059 1.094 1.195 1.305 1423 1.551 1.689 1.838 1.999 2.172 2358 2773 3.252 3.518 1.105 1.219 1.344 1.480 1.629 1.791 1.967 2 159 2367 2.594 3.106 3.707 4.046 1.116 1.243 1.384 1.539 1.710 1.898 2105 2332 2580 2853 3.479 4.226 4.652 1.127 1268 1.426 1.601 1796 2012 2.252 2518 2813 3.138 3.896 4.818 5.350 1.138 1.294 1.469 1665 1.886 2133 2.410 2.720 3.066 3.452 4.363 5.492 6.153 1.149 1319 1.513 1732 1.980 2261 2.579 2.937 3.342 3.798 4.887 6.261 7.076 1.161 1 346 1.558 1.801 2079 2.397 2759 3.172 3.642 4.177 5.4747.138 8.137 1.173 1,373 1.605 1873 2.183 2540 2.952 3.426 3.970 4.595 6.130 8.137 9368 1.184 1.400 1.853 1.948 2.292 2693 3.159 3.700 4.3285.054 6.866 9.276 10.76 CO 0 no 47 he OCA 9700 LE TO The company is considering two possible expansion plans. Plan A would open eight smaller shops at a cost of $8,700,000. Expected annual net cash inflows are $1,550,000 for 10 years, with zero residual value at the end of 10 years. Under Plan B, Hill Company would open three larger shops at a cost of $8,340,000. This plan is expected to generate net cash inflows of $990,000 per year for 10 years, the estimated useful life of the properties. Estimated residual value for Plan B is $1,200,000. Hill Company uses straight-line depreciation and requires an annual return of 10% Print Done