

Answered step by step
Verified Expert Solution
Question
1 Approved Answer
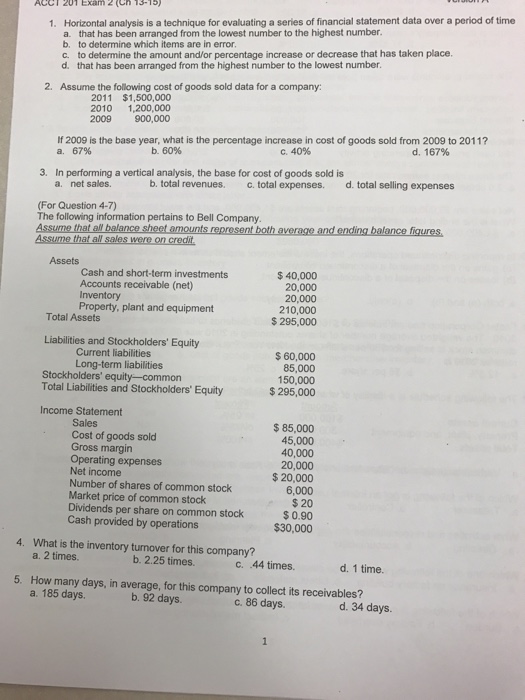
Horizontal analysis is a technique for evaluating a series of financial statement data over a period of time a. that has been arranged from the
Step by Step Solution
There are 3 Steps involved in it
Step: 1

Get Instant Access to Expert-Tailored Solutions
See step-by-step solutions with expert insights and AI powered tools for academic success
Step: 2

Step: 3
Ace Your Homework with AI
Get the answers you need in no time with our AI-driven, step-by-step assistance
Get Started
Trucking Industry IRS Audit Techniques Guide
Authors: Internal Revenue Service
1st Edition
1304135640, 978-1304135643