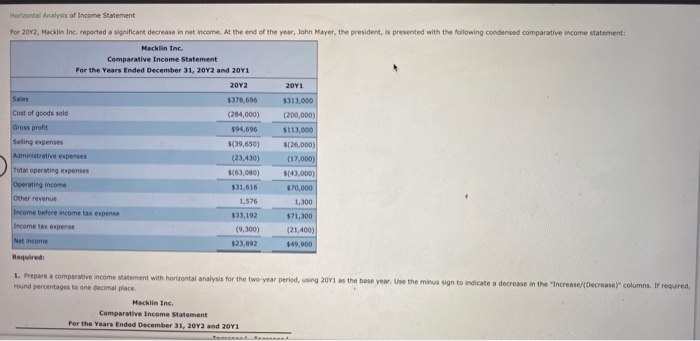
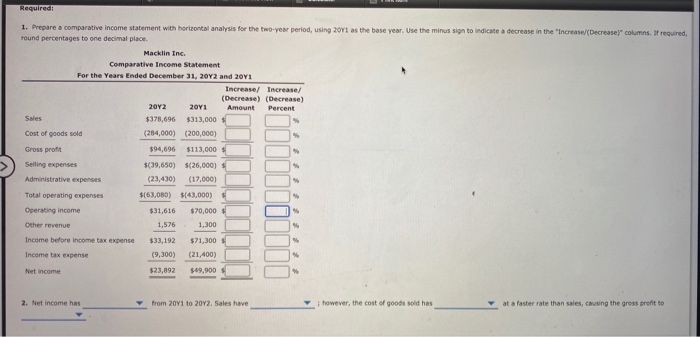
Horizontal Analysis of Income Statement For 2012, Macklin Inc. reported a significant decrease in net income. At the end of the year, John Mayer, the president, is presented with the following condensed comparative Income statement: Macklin Inc. Comparative Income Statement For the Years Ended December 31, 2012 and 2011 2012 2011 Sales $378,696 $313.000 Cost of goods sold (254,000) (200,000) Gross profit $94,696 $113,000 Seling expenses $(39,650) $(26,000) Administrative expenses (23,430) (17.000) Total operating expenses (63,080) $(43,000) Operating income $31,616 $70,000 Other revenue 1,576 1,300 Income before income tax expense $33,192 $71,300 Income tax expense (9,300) (21,400) Net income $23,092 149,900 Required 1. Prepare a comparative income statement with horizontal analysis for the two-year period, using 2011 as the bese year. Use the minus sign to indicate a decrease in the increase/Decrease)" columns. If required round percentages to one decimal place Macklin Inc. Comparative Income Statement For the Years Ended December 31, 2012 and 2011 Required 1. Prepare a comparative income statement with horizontal analysis for the two-year period, using 2071 as the base year. Use the minus sign to indicate a decrease in the "Increase/(Decrease}" columns. If required, round percentages to one decimal place. Macklin Inc. Comparative Income Statement For the Years Ended December 31, 2012 and 2011 Increase/ Increase/ (Decrease) (Decrease) 2012 2011 Amount Percent Sales $378,696 $313,000 Cost of goods sold (284,000) (200,000) Gross profit $94,696 $113,000 Selling expenses $(39,650) 5(26,000) Administrative expenses (23,430) (17,000) Total operating expenses $(63,080) $(43,000) Operating income $31,616 $70,000 Other revenue 1,576 1,300 Income before income tax expense $33,192 $71,300 Income tax expense (9,300) (21,400) Net income $23,892 $49,900 2. Net income has from 2011 to 2012. Sales have however, the cost of goods sold has at a faster rate than sales, causing the gross profitto


